

Question: Consider the table below. It shows three performance measures for 10 students. Student Test score IQ Study hours 100 125 30 95 104 40 92


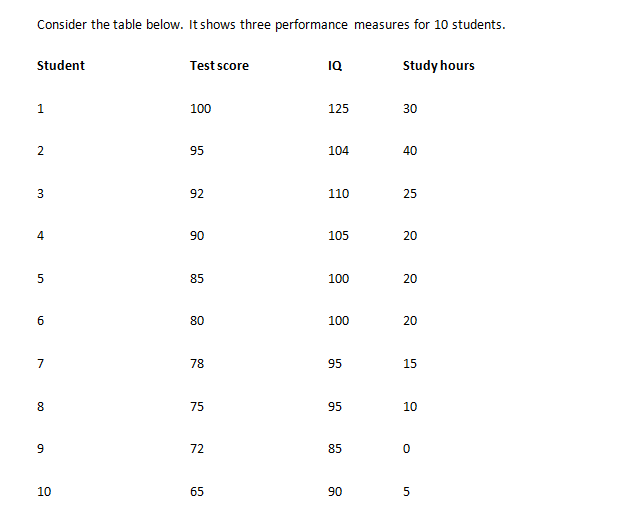
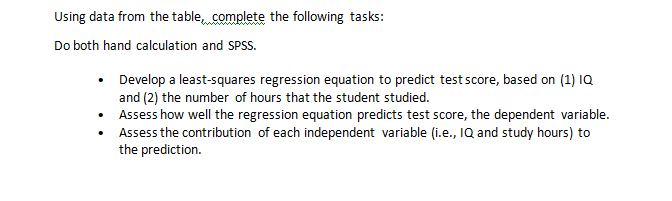
Consider the table below. It shows three performance measures for 10 students. Student Test score IQ Study hours 100 125 30 95 104 40 92 110 25 4 90 105 20 85 100 20 6 80 100 20 78 95 15 CO 75 95 10 9 72 85 10 65 90 5Using data from the table, complete the following tasks: Do both hand calculation and SPSS. . Develop a least-squares regression equation to predict test score, based on (1) 10 and (2) the number of hours that the student studied. Assess how well the regression equation predicts test score, the dependent variable. Assess the contribution of each independent variable (i.e., IQ and study hours) to the prediction
Step by Step Solution
There are 3 Steps involved in it

Get step-by-step solutions from verified subject matter experts