

Question: Consider the table below: Quantity of real GDP demanded Quantity of real GDP supplied Price Level (trillions $) (trillions $) 210 10 20 205 15
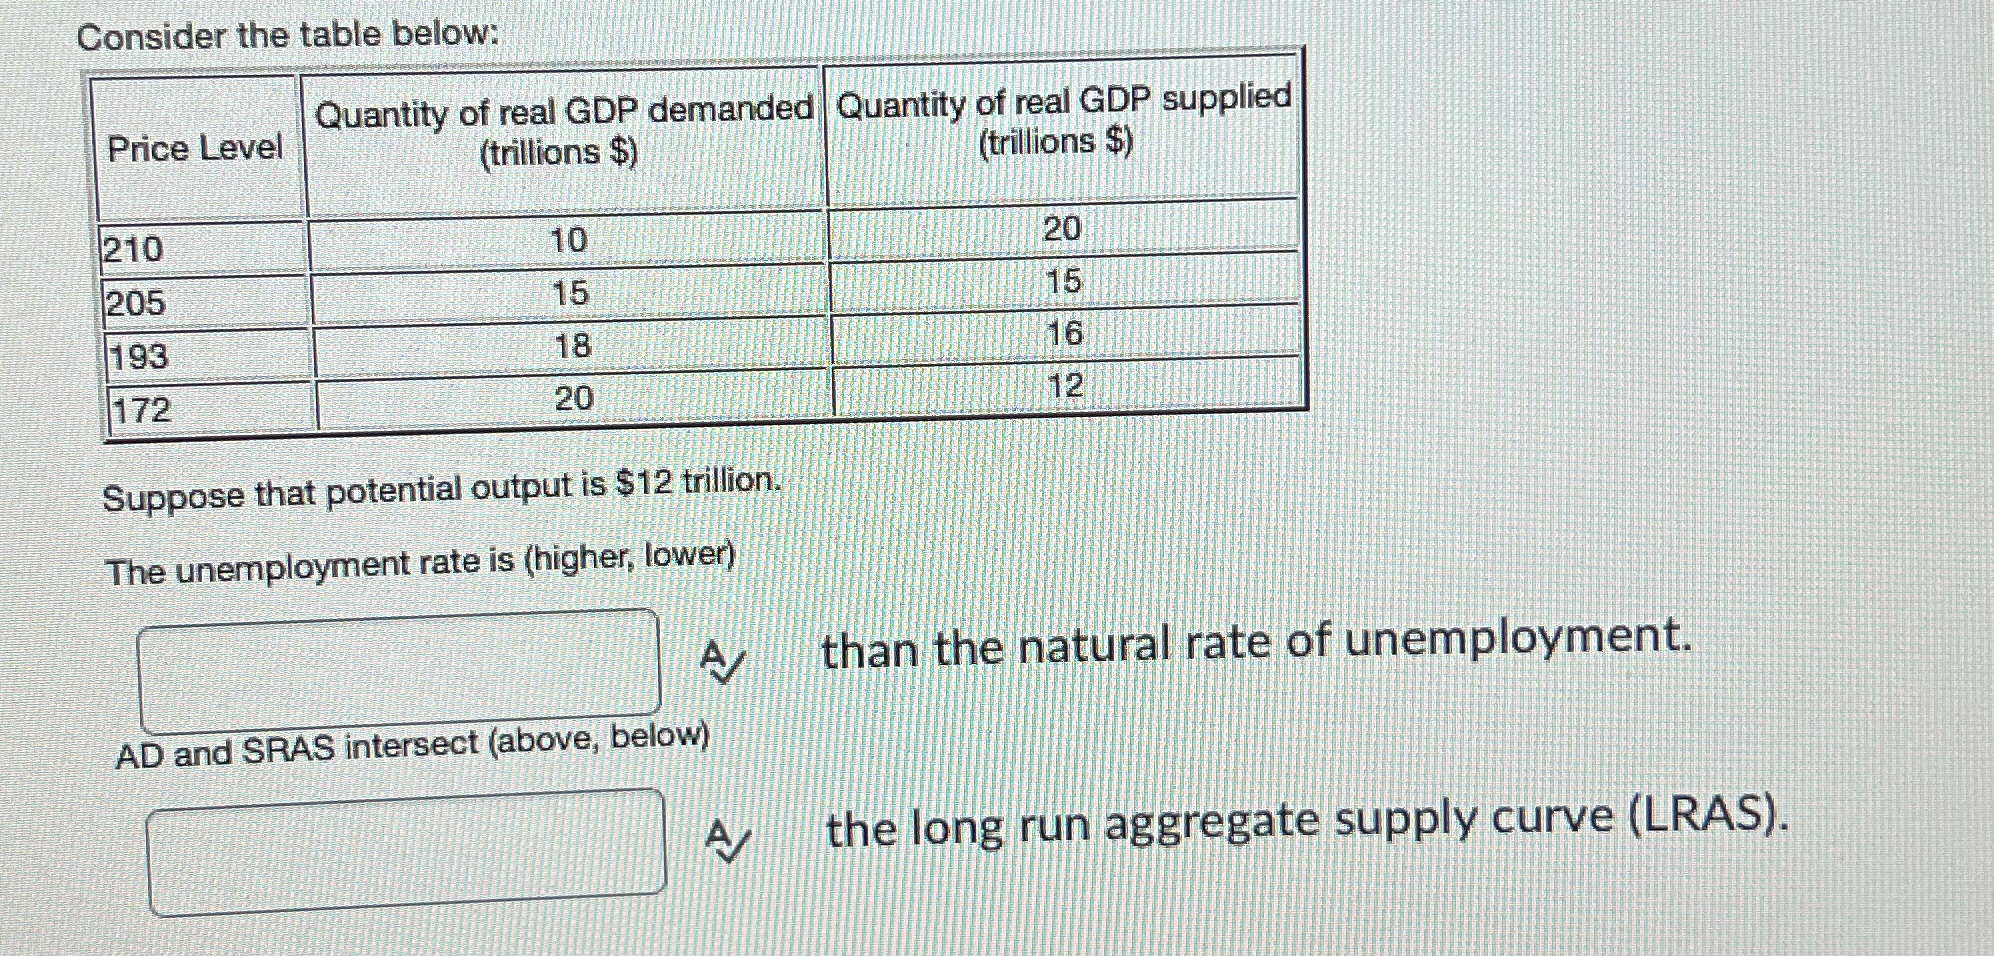
Consider the table below: Quantity of real GDP demanded Quantity of real GDP supplied Price Level (trillions $) (trillions $) 210 10 20 205 15 15 193 18 16 172 20 12 Suppose that potential output is $12 trillion. The unemployment rate is (higher, lower) than the natural rate of unemployment. AD and SRAS intersect (above, below) A/ the long run aggregate supply curve (LRAS)
Step by Step Solution
There are 3 Steps involved in it
1 Expert Approved Answer
Step: 1 Unlock

Question Has Been Solved by an Expert!
Get step-by-step solutions from verified subject matter experts
Step: 2 Unlock
Step: 3 Unlock