

Question: Consider the table below. Using the information in the table, explain and interpret the gamma and chi square measures. Table 5 Race and Preferences on
Consider the table below. Using the information in the table, explain and interpret the gamma and chi square measures.
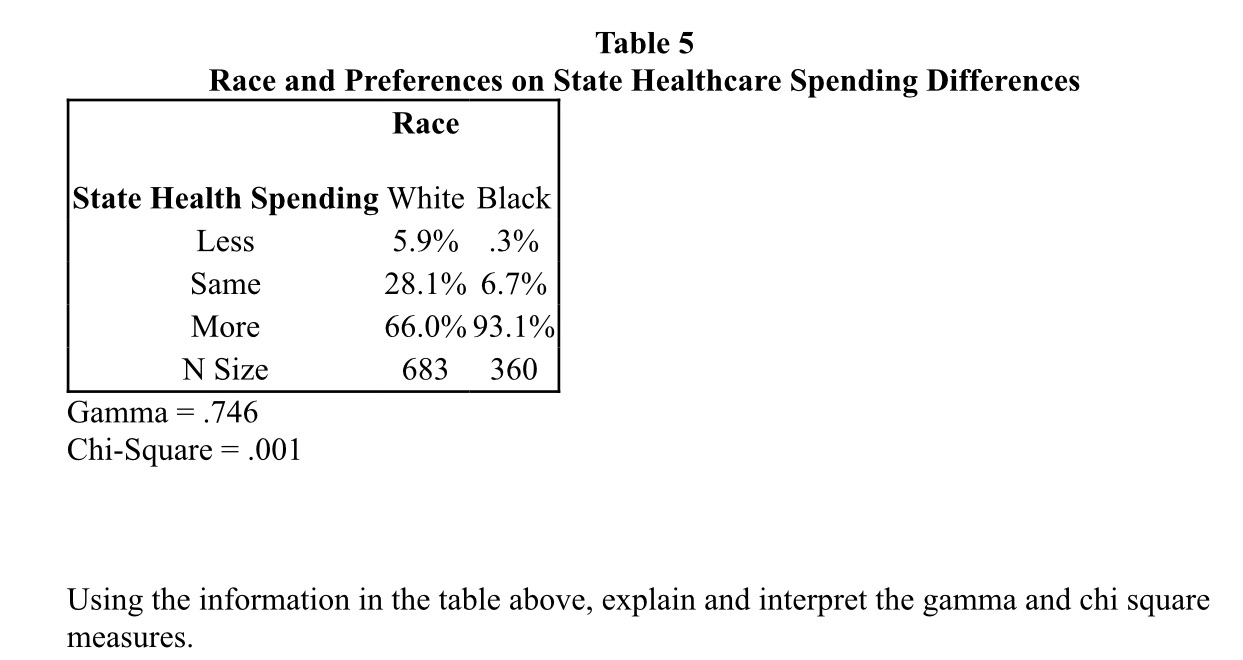
Table 5 Race and Preferences on State Healthcare Spending Differences Race State Health Spending White Black Less 5.9% 3% Same 28.1% 6.7% More 66.0% 93.1% N Size 683 360 Gamma = .746 Chi-Square = .001 Using the information in the table above, explain and interpret the gamma and chi square measures
Step by Step Solution
There are 3 Steps involved in it
1 Expert Approved Answer
Step: 1 Unlock

Question Has Been Solved by an Expert!
Get step-by-step solutions from verified subject matter experts
Step: 2 Unlock
Step: 3 Unlock