

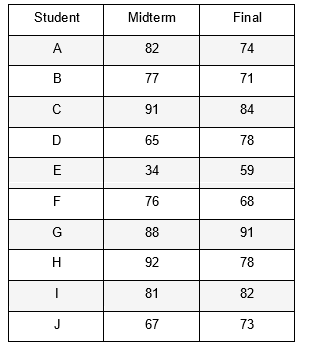
Question: Consider the table below, which gives the midterm and final exam scores for a sample of 10 students in a college class. Give all numerical
Consider the table below, which gives the midterm and final exam scores for a sample of 10 students in a college class. Give all numerical answers below accurate to three decimal places.
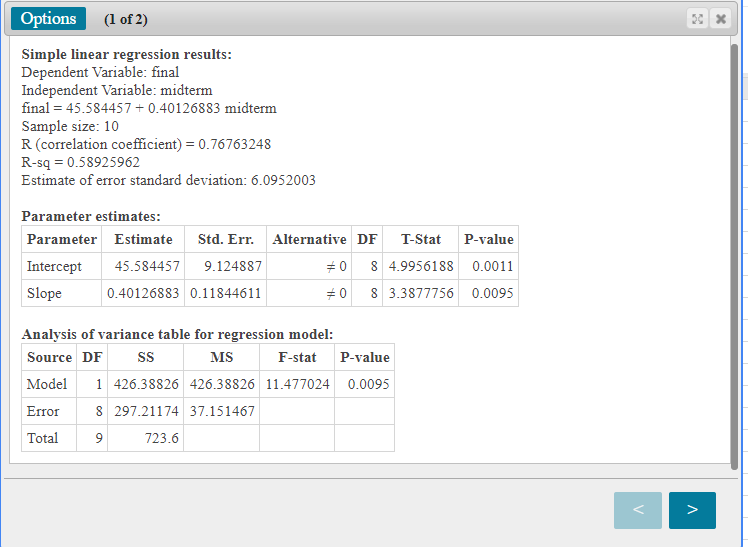
Options (1 of 2) Simple linear regression results: Dependent Variable: final Independent Variable: midterm final = 45.584457 + 0.40126883 midterm Sample size: 10 R (correlation coefficient) = 0.76763248 R-sq = 0.58925962 Estimate of error standard deviation: 6.0952003 Parameter estimates: Parameter Estimate Std. Err. Alternative DF T-Stat P-value Intercept 45.584457 9.124887 8 4.9956188 0.0011 Slope 0.40126883 0.11844611 #0 8 3.3877756 0.0095 Analysis of variance table for regression model: Source DF SS MS F-stat P-value Model 1 426.38826 426.38826 11.477024 0.0095 Error 8 297.21174 37.151467 Total 9 723.6 \f\f
Step by Step Solution
There are 3 Steps involved in it

Get step-by-step solutions from verified subject matter experts