

Question: Consider the table below with expected returns, volatilities, and correlations Expected Standard Correlation with Correlation Correlation Stock Return Deviation TD Bank with Shoppers with
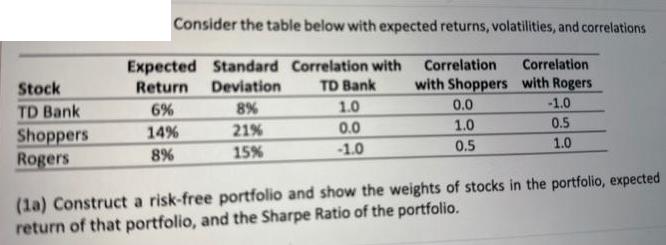
Consider the table below with expected returns, volatilities, and correlations Expected Standard Correlation with Correlation Correlation Stock Return Deviation TD Bank with Shoppers with Rogers TD Bank 6% 8% 1.0 0.0 -1.0 Shoppers 14% 21% 0.0 1.0 0.5 Rogers 8% 15% -1.0 0.5 1.0 (1a) Construct a risk-free portfolio and show the weights of stocks in the portfolio, expected return of that portfolio, and the Sharpe Ratio of the portfolio.
Step by Step Solution
There are 3 Steps involved in it
1 Expert Approved Answer
Step: 1 Unlock

Question Has Been Solved by an Expert!
Get step-by-step solutions from verified subject matter experts
Step: 2 Unlock
Step: 3 Unlock