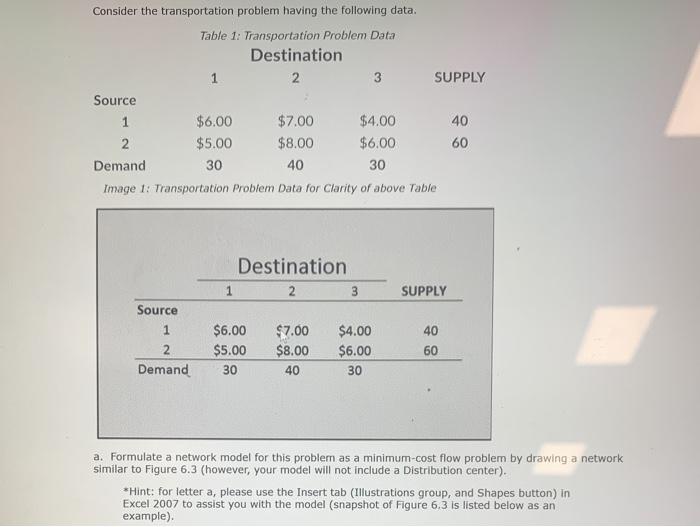
Question: Consider the transportation problem having the following data. Table 1: Transportation Problem Data Destination 1 2 3 SUPPLY Source 1 $6.00 $7.00 $4.00 40 2

Consider the transportation problem having the
Consider the transportation problem having the following data. Table 1: Transportation Problem Data Destination 1 2 3 SUPPLY Source 1 $6.00 $7.00 $4.00 40 2 $5.00 $8.00 $6.00 60 Demand 30 40 30 Image 1: Transportation Problem Data for Clarity of above Table Destination 2 3 1 SUPPLY Source 1 2 Demand $6.00 $5.00 30 $7.00 $8.00 40 $4.00 $6.00 30 40 60 a. Formulate a network model for this problem as a minimum-cost flow problem by drawing a network similar to Figure 6.3 (however, your model will not include a Distribution center). *Hint: for letter a, please use the Insert tab (Illustrations group, and Shapes button) in Excel 2007 to assist you with the model (snapshot of Figure 6,3 is listed below as an example) [80] [- 60] $700 F1 W1 $300 1501 [0] $200 [50] DC $400 1501 $400 [30] $900 F2 W2 [- 90] [70] b. Formulate and solve a spreadsheur model for this

Step by Step Solution

There are 3 Steps involved in it

1 Expert Approved Answer
Step: 1 Unlock blur-text-image
Question Has Been Solved by an Expert!

Get step-by-step solutions from verified subject matter experts

Step: 2 Unlock
Step: 3 Unlock

Students Have Also Explored These Related General Management Questions!