

Question: Consider the U.S. population data from 1790 to 1890 given in Table 1.5. a) Calculate the correlation coefficient ryy for these (P, t) data.
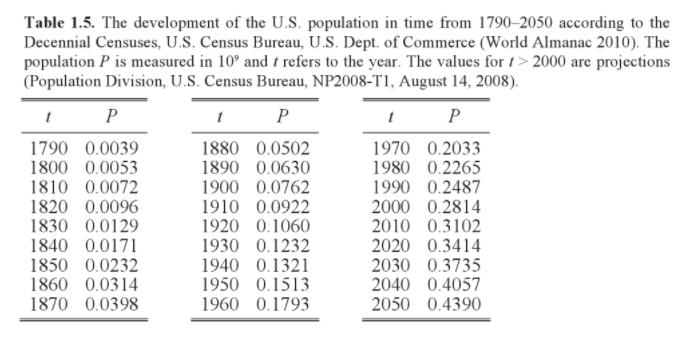
Consider the U.S. population data from 1790 to 1890 given in Table 1.5. a) Calculate the correlation coefficient ryy for these (P, t) data. b) Consider the same t data. Replace the P data by the function values PM 0.0039 exp[(t-1790)/35]. Find ry for the (PM, 1) data. c) Use the data (P, t) from Table 1.5 to generate new (In P, t) data. Calculate the correlation coefficient ry for the (In P, t) data. d) Replace in the latter data In P by In Py. Find rxy for the (In P, 1) data. e) What do these four correlation coefficients tell us? Table 1.5. The development of the U.S. population in time from 1790-2050 according to the Decennial Censuses, U.S. Census Bureau, U.S. Dept. of Commerce (World Almanac 2010). The population P is measured in 10 and t refers to the year. The values fort> 2000 are projections (Population Division, U.S. Census Bureau, NP2008-T1, August 14, 2008). P P P 1790 0.0039 1800 0.0053 1810 0.0072 1820 0.0096 1880 0.0502 1890 0.0630 1900 0.0762 1910 0.0922 1920 0.1060 1970 0.2033 1980 0.2265 1990 0.2487 2000 0.2814 2010 0.3102 1830 0.0129 1840 0.0171 1850 0.0232 1860 1930 0.1232 1940 0.1321 1950 0.1513 1960 0.1793 2020 0.3414 2030 0.3735 2040 0.4057 2050 0.4390 0.0314 1870 0.0398
Step by Step Solution
3.50 Rating (160 Votes )
There are 3 Steps involved in it
To solve the problem we will follow these steps a Calculate the correlation coefficient rxy for the ... View full answer

Get step-by-step solutions from verified subject matter experts