

Question: Consider this plot, where each blue point is a possible portfolio of stocks. A portfolio has a 3% expected return with 0.6% standard deviation of
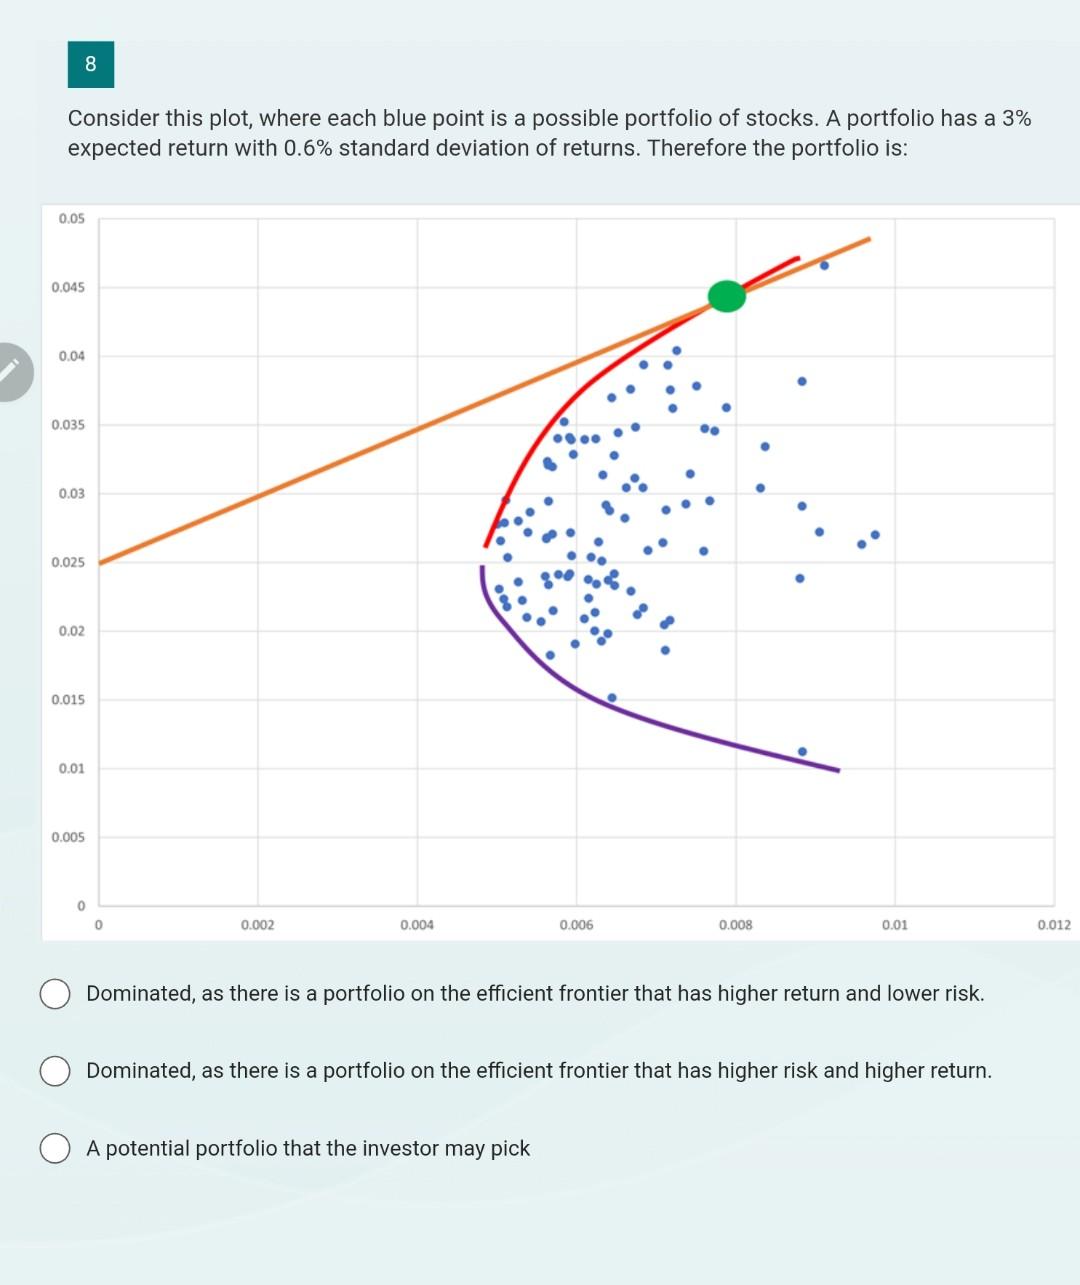
Consider this plot, where each blue point is a possible portfolio of stocks. A portfolio has a 3% expected return with 0.6% standard deviation of returns. Therefore the portfolio is: Dominated, as there is a portfolio on the efficient frontier that has higher return and lower risk. Dominated, as there is a portfolio on the efficient frontier that has higher risk and higher return. A potential portfolio that the investor may pick
Step by Step Solution
There are 3 Steps involved in it
1 Expert Approved Answer
Step: 1 Unlock

Question Has Been Solved by an Expert!
Get step-by-step solutions from verified subject matter experts
Step: 2 Unlock
Step: 3 Unlock