

Question: Consider this regression analysis output table and residual plot. The owner of a small bakery is interested in forecasting the bakery's total sales for a
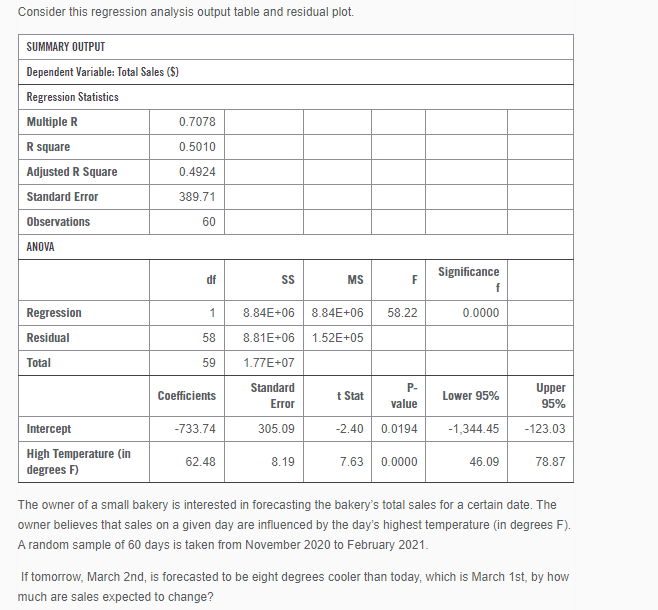
Consider this regression analysis output table and residual plot.
The owner of a small bakery is interested in forecasting the bakery's total sales for a certain date. The
owner believes that sales on a given day are influenced by the day's highest temperature in degrees F
A random sample of days is taken from November to February
If tomorrow, March nd is forecasted to be eight degrees cooler than today, which is March st by how
much are sales expected to change?
Step by Step Solution
There are 3 Steps involved in it
1 Expert Approved Answer
Step: 1 Unlock

Question Has Been Solved by an Expert!
Get step-by-step solutions from verified subject matter experts
Step: 2 Unlock
Step: 3 Unlock