

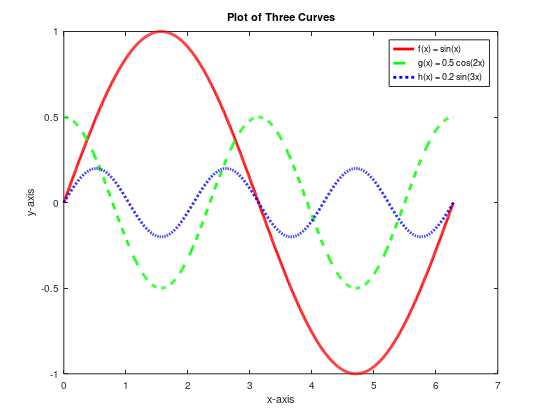
Question: Consider three mathematical functions defined as follows: f ( x ) = sin ( x ) g ( x ) = 0 . 5 cos
Consider three mathematical functions defined as follows:
fxsinx
gxcosx
hxsinx
Write a MATLAB script to plot these three functions on the same graph over the interval
xpi Use different line styles, colors, and markers for each curve to make the plot visually appealing. Include labels for the xaxis, yaxis, and a legend for each curve.
Submit your MATLAB script along with the resulting plot.
Step by Step Solution
There are 3 Steps involved in it
1 Expert Approved Answer
Step: 1 Unlock

Question Has Been Solved by an Expert!
Get step-by-step solutions from verified subject matter experts
Step: 2 Unlock
Step: 3 Unlock