

Question: Consider two lift charts below, which represent two different classification problems. Chart A shows the rate of success in finding customers who are predicted to
- Consider two lift charts below, which represent two different classification problems. Chart A shows the rate of success in finding customers who are predicted to repay a loan on time. Chart B involves finding customers who will accept a loan offer.
Lift chart A
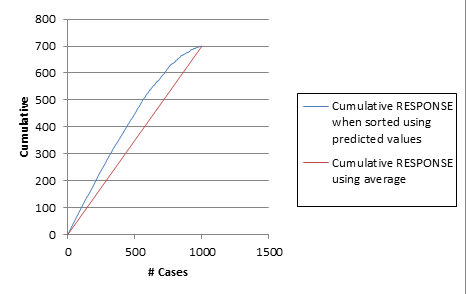
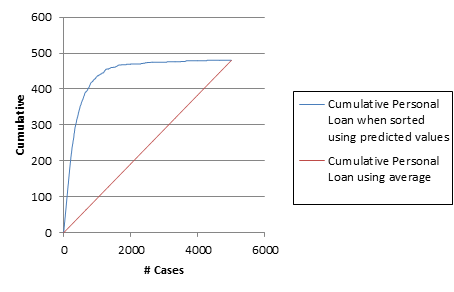
800 700 600 500 Cumulative RESPONSE Cumulative 400 when sorted using predicted values 300 Cumulative RESPONSE 200 using average 100 0 500 1000 1500 # Cases600 500 400 Cumulative Personal Cumulative 300 Loan when sorted using predicted values 200 Cumulative Personal Loan using average 100 0 2000 4000 6000 # Cases
Step by Step Solution
There are 3 Steps involved in it
1 Expert Approved Answer
Step: 1 Unlock

Question Has Been Solved by an Expert!
Get step-by-step solutions from verified subject matter experts
Step: 2 Unlock
Step: 3 Unlock