

Question: Considering the trend followed by your data points explain if your data agrees with your hypothesis? Introduction: It is perhaps common sense to many people
Considering the trend followed by your data points explain if your data agrees with your hypothesis?
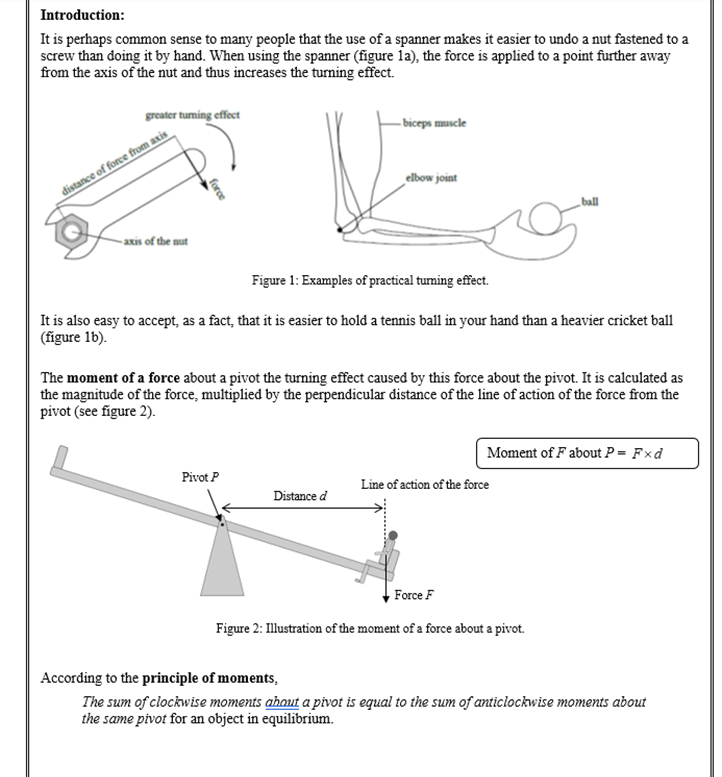
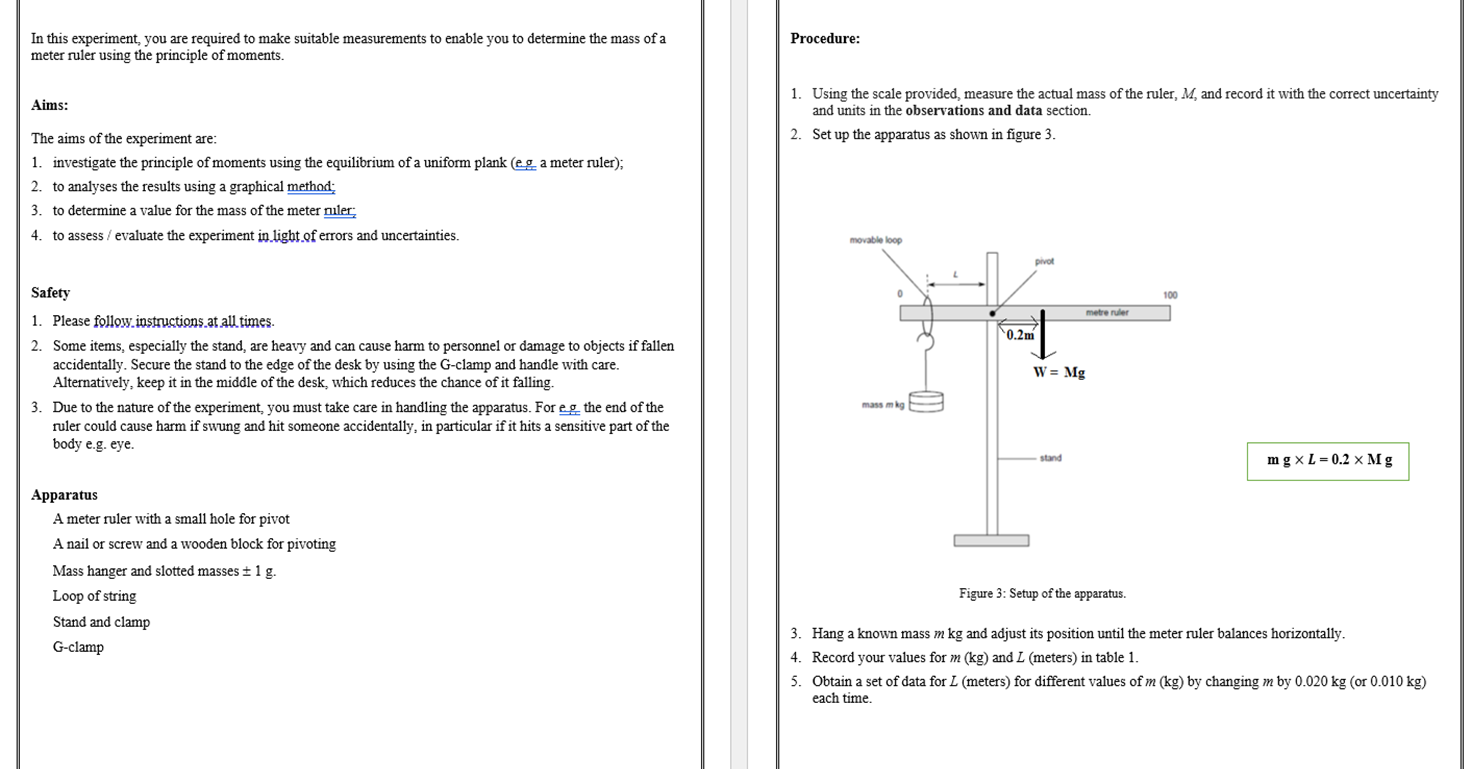
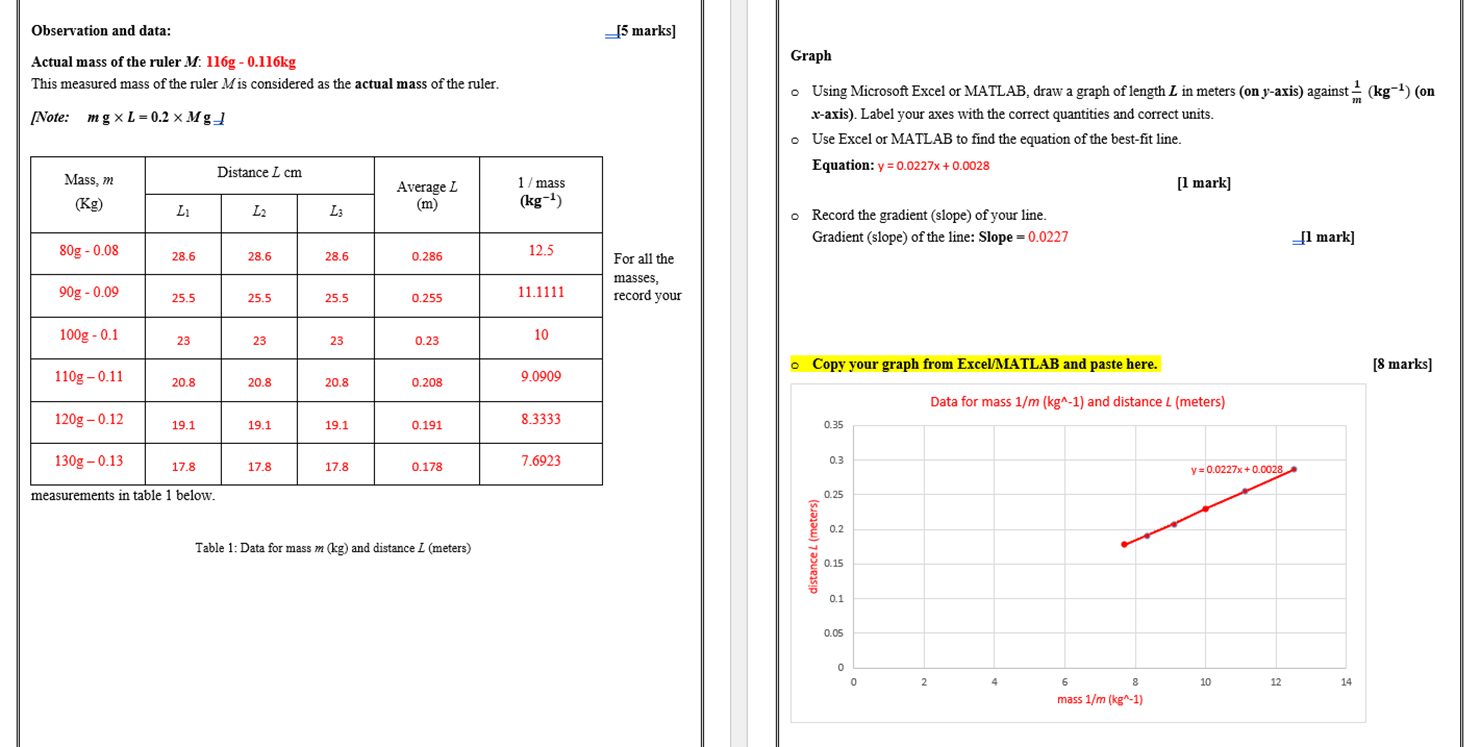
Introduction: It is perhaps common sense to many people that the use of a spanner makes it easier to undo a nut fastened to a screw than doing it by hand. When using the spanner (figure la), the force is applied to a point further away from the axis of the nut and thus increases the turning effect. greater turning effect - biceps muscle distance of force from axis elbow joint force axis of the nut Figure 1: Examples of practical turning effect. It is also easy to accept, as a fact, that it is easier to hold a tennis ball in your hand than a heavier cricket ball (figure 1b). The moment of a force about a pivot the turning effect caused by this force about the pivot. It is calculated as the magnitude of the force, multiplied by the perpendicular distance of the line of action of the force from the pivot (see figure 2). Moment of F about P = Fxd Pivot P Line of action of the force Distance d Force F Figure 2: Illustration of the moment of a force about a pivot. According to the principle of moments, The sum of clockwise moments about a pivot is equal to the sum of anticlockwise moments about the same pivot for an object in equilibrium.In this experiment, you are required to make suitable measurements to enable you to determine the mass of a Procedure: meter ruler using the principle of moments. 1. Using the scale provided, measure the actual mass of the ruler, M, and record it with the correct uncertainty Aims: and units in the observations and data section. The aims of the experiment are: 2. Set up the apparatus as shown in figure 3. 1. investigate the principle of moments using the equilibrium of a uniform plank (e g a meter ruler); 2. to analyses the results using a graphical method; 3. to determine a value for the mass of the meter miler: 4. to assess / evaluate the experiment in light of errors and uncertainties. movable loop Safety metre ruler 1. Please follow instructions at all times. '0.2m 2. Some items, especially the stand, are heavy and can cause harm to personnel or damage to objects if fallen accidentally. Secure the stand to the edge of the desk by using the G-clamp and handle with care. W = Mg Alternatively, keep it in the middle of the desk, which reduces the chance of it falling. 3. Due to the nature of the experiment, you must take care in handling the apparatus. For e g the end of the mass m kg ruler could cause harm if swung and hit someone accidentally, in particular if it hits a sensitive part of the body e.g. eye. - stand mgXL=0.2 x Mg Apparatus A meter ruler with a small hole for pivot A nail or screw and a wooden block for pivoting Mass hanger and slotted masses = 1 g. Loop of string Figure 3: Setup of the apparatus. Stand and clamp 3. Hang a known mass m kg and adjust its position until the meter ruler balances horizontally. G-clamp 4. Record your values for m (kg) and L (meters) in table 1. 5. Obtain a set of data for L (meters) for different values of m (kg) by changing m by 0.020 kg (or 0.010 kg) each time.Observation and data: [5 marks] Actual mass of the ruler M: 116g - 0.116kg Graph This measured mass of the ruler Mis considered as the actual mass of the ruler. o Using Microsoft Excel or MATLAB, draw a graph of length L in meters (on y-axis) against _ (kg-1) (on (Note: mg XL=0.2 x Mg] x-axis). Label your axes with the correct quantities and correct units. o Use Excel or MATLAB to find the equation of the best-fit line. Mass, m Distance _ cm Equation: y = 0.0227x + 0.0028 Average L 1 / mass [1 mark] (Kg) (kg-1) L1 L2 L3 (m) o Record the gradient (slope) of your line. Gradient (slope) of the line: Slope = 0.0227 [1 mark] 80g - 0.08 28.6 28.6 28.6 0.286 12.5 For all the masses 90g - 0.09 25.5 25.5 25.5 0.255 11.1111 record your 100g - 0.1 23 23 23 0.23 10 o Copy your graph from Excel/MATLAB and paste here. [8 marks] 110g - 0.11 20.8 20.8 20.8 0.208 9.0909 Data for mass 1/m (kg^-1) and distance L (meters) 120g - 0.12 19.1 19.1 19.1 0.191 8.3333 0.35 130g - 0.13 17.8 17.8 17.8 0.178 7.6923 0.3 y = 0.0227x + 0.0028 measurements in table 1 below. 0.25 0.2 Table 1: Data for mass m (kg) and distance _ (meters) distance L (meters 0.15 0.1 0.05 0 2 6 8 10 12 14 mass 1/m (kg"-1)
Step by Step Solution
There are 3 Steps involved in it

Get step-by-step solutions from verified subject matter experts