

Question: Consolidated Balance Sheets - USD (S) Dec. 29, 2018 Dec. 30, 2017 $ in Thousands Current: Cash and cash equivalent Marketable securities SERP investment Accounts
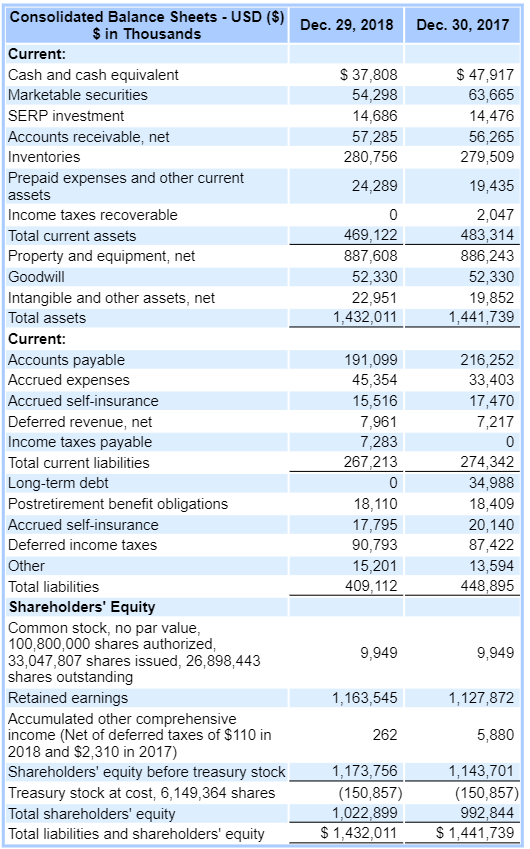
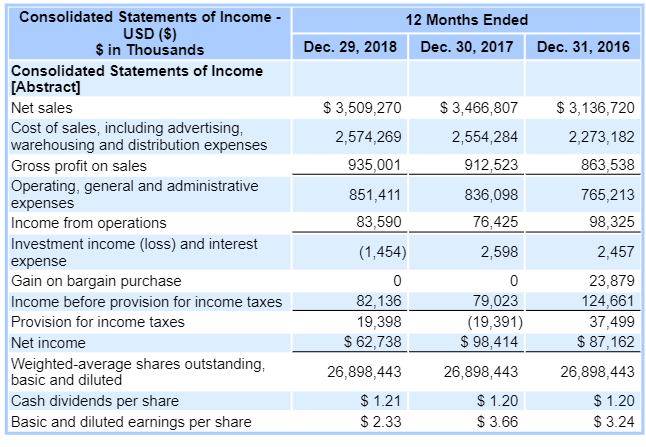
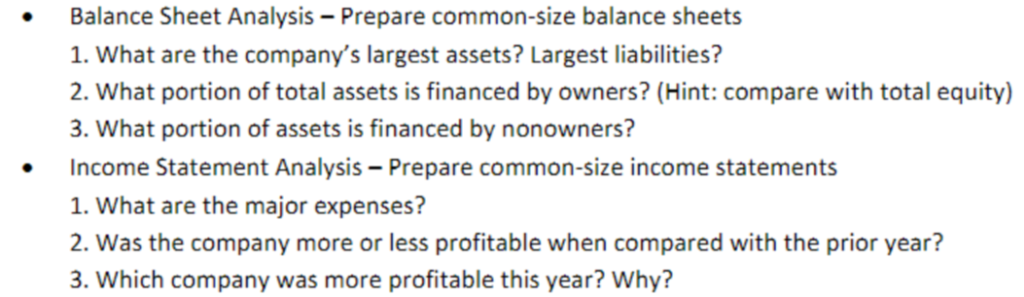
Consolidated Balance Sheets - USD (S) Dec. 29, 2018 Dec. 30, 2017 $ in Thousands Current: Cash and cash equivalent Marketable securities SERP investment Accounts receivable, net Inventories Prepaid expenses and other current assets Income taxes recoverable Total current assets Property and equipment, net Goodwill Intangible and other assets, net Total assets Current Accounts payable Accrued expenses Accrued self-insurance Deferred revenue, net Income taxes payable Total current liabilities Long-term debt Postretirement benefit obligations Accrued self-insurance Deferred income taxes S 37,808 54,298 14,686 57,285 280,756 $ 47,917 63,665 14,476 56,265 279,509 24,289 19,435 2,047 483,314 886,243 52,330 19,852 1,441,739 469,122 887,608 52,330 22,951 1,432,011 191,099 216,252 33,403 17,470 15,516 267.213 274,342 34,988 18,409 20,140 87,422 13,594 448,895 18,110 17,795 90,793 15,201 409.112 er Total liabilities Shareholders' Equity Common stock, no par value 100,800,000 shares authorized 33,047,807 shares issued, 26,898,443 shares outstanding Retained earnings Accumulated other comprehensive income (Net of deferred taxes of $110 in 2018 and $2,310 in 2017) Shareholders' equity before treasury stock Treasury stock at cost, 6,149,364 shares Total shareholders' equity Total liabilities and shareholders' equity 9,949 9,949 1,163,545 1,127,872 5,880 1,143,701 (150,857) 992,844 S 1,441,739 1.173.756 (150,857) 1.022.899 $ 1,432,011 Consolidated Statements of Income - USD ($) $ in Thousands 12 Months Ended Dec. 29, 2018 Dec. 30, 2017 Dec. 31, 2016 Consolidated Statements of Income [Abstract] Net sales Cost of sales, including advertising warehousing and distribution expenses Gross profit on sales Operating, general and administrative expenses Income from operations Investment income (loss) and interest expense Gain on bargain purchase Income before provision for income taxes Provision for income taxes Net income Weighted-average shares outstanding basic and diluted Cash dividends per share Basic and diluted earnings per share S 3,509,270 S3,466,807S 3,136,720 2,554,284 912,523 836,098 76,425 2,598 2,273,182 2,574,269 935,001 851,411 83,590 (1,454) 863,538 765,213 98,325 2,457 23,879 124,661 37,499 $ 87,162 79,023 (19,391) $98,414 82,136 19,398 $ 62,738 26,898,44:3 $1.21 $ 2.33 26,898,443 $1.20 $ 3.24 26,898,443 $ 1.20 $ 3.66 Balance Sheet Analysis Prepare common-size balance sheets 1. What are the company's largest assets? Largest liabilities? 2. What portion of total assets is financed by owners? (Hint: compare with total equity) 3. What portion of assets is financed by nonowners? Income Statement Analysis- Prepare common-size income statements 1. What are the major expenses? 2. Was the company more or less profitable when compared with the prior year? . Which company was more profitable this year? Why? Consolidated Balance Sheets - USD (S) Dec. 29, 2018 Dec. 30, 2017 $ in Thousands Current: Cash and cash equivalent Marketable securities SERP investment Accounts receivable, net Inventories Prepaid expenses and other current assets Income taxes recoverable Total current assets Property and equipment, net Goodwill Intangible and other assets, net Total assets Current Accounts payable Accrued expenses Accrued self-insurance Deferred revenue, net Income taxes payable Total current liabilities Long-term debt Postretirement benefit obligations Accrued self-insurance Deferred income taxes S 37,808 54,298 14,686 57,285 280,756 $ 47,917 63,665 14,476 56,265 279,509 24,289 19,435 2,047 483,314 886,243 52,330 19,852 1,441,739 469,122 887,608 52,330 22,951 1,432,011 191,099 216,252 33,403 17,470 15,516 267.213 274,342 34,988 18,409 20,140 87,422 13,594 448,895 18,110 17,795 90,793 15,201 409.112 er Total liabilities Shareholders' Equity Common stock, no par value 100,800,000 shares authorized 33,047,807 shares issued, 26,898,443 shares outstanding Retained earnings Accumulated other comprehensive income (Net of deferred taxes of $110 in 2018 and $2,310 in 2017) Shareholders' equity before treasury stock Treasury stock at cost, 6,149,364 shares Total shareholders' equity Total liabilities and shareholders' equity 9,949 9,949 1,163,545 1,127,872 5,880 1,143,701 (150,857) 992,844 S 1,441,739 1.173.756 (150,857) 1.022.899 $ 1,432,011 Consolidated Statements of Income - USD ($) $ in Thousands 12 Months Ended Dec. 29, 2018 Dec. 30, 2017 Dec. 31, 2016 Consolidated Statements of Income [Abstract] Net sales Cost of sales, including advertising warehousing and distribution expenses Gross profit on sales Operating, general and administrative expenses Income from operations Investment income (loss) and interest expense Gain on bargain purchase Income before provision for income taxes Provision for income taxes Net income Weighted-average shares outstanding basic and diluted Cash dividends per share Basic and diluted earnings per share S 3,509,270 S3,466,807S 3,136,720 2,554,284 912,523 836,098 76,425 2,598 2,273,182 2,574,269 935,001 851,411 83,590 (1,454) 863,538 765,213 98,325 2,457 23,879 124,661 37,499 $ 87,162 79,023 (19,391) $98,414 82,136 19,398 $ 62,738 26,898,44:3 $1.21 $ 2.33 26,898,443 $1.20 $ 3.24 26,898,443 $ 1.20 $ 3.66 Balance Sheet Analysis Prepare common-size balance sheets 1. What are the company's largest assets? Largest liabilities? 2. What portion of total assets is financed by owners? (Hint: compare with total equity) 3. What portion of assets is financed by nonowners? Income Statement Analysis- Prepare common-size income statements 1. What are the major expenses? 2. Was the company more or less profitable when compared with the prior year? . Which company was more profitable this year? Why
Step by Step Solution
There are 3 Steps involved in it

Get step-by-step solutions from verified subject matter experts