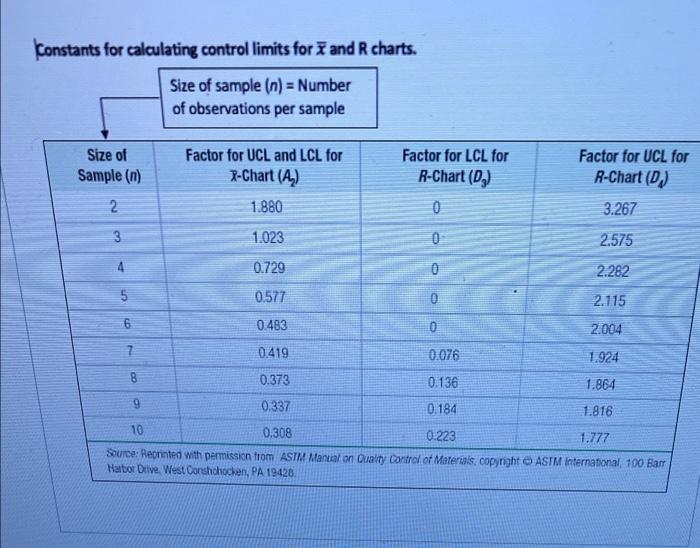
Question: Constants for calculating control limits for 7 and R charts. Size of sample (n) = Number of observations per sample Size of Sample (n) Factor

Constants for calculating control limits for 7
Constants for calculating control limits for 7 and R charts. Size of sample (n) = Number of observations per sample Size of Sample (n) Factor for UCL and LCL for 7-Chart (4) 1.880 Factor for LCL for R-Chart (03) 0 Factor for UCL for R-Chart (D) 2. 3.267 3 1.023 0 2.575 0.729 0 2.282 5 5 0.577 2.115 6 0.483 0 2.004 7 7 0.419 0.076 1.924 8 0.373 0.136 1.864 9 0.337 0.184 1.816 10 0.308 0.223 1.777 Source: Reprinted with permission from ASIM Manual on Quality Control of Materials copyright ASTM International 100 Bar Harbor Drive, West Conshchochen, PA 19428 The management of West Allis Industries is concerned about the production of a special metal screw used by several of the company's largest customers. The diameter of the screw is critical to the customers. Data from five samples appear in the accompanying table. The sample size is 4. compute the UCLR, LCLR values. Sample Observation Observation ObservationObservation Number 1 2 3 R X-bar 0.5014 0.5022 0.5009 0.5027 0.00180.5018 2 0.5021 0.5041 0.5024 0.5020 0.00210.5027 3 0.5018 0.5026 6.5035 6.5023 0.00170.5026 14 0.5008 0.5034 0.5024 0.5015 0.00260.5020 0.5041 0.5056 0.5034 0.5047 0.00220.5045 Average 0.00210.5027 UCL R [Choose] 0.0021 0.00479 LCL_R

Step by Step Solution

There are 3 Steps involved in it

1 Expert Approved Answer
Step: 1 Unlock blur-text-image
Question Has Been Solved by an Expert!

Get step-by-step solutions from verified subject matter experts

Step: 2 Unlock
Step: 3 Unlock

Students Have Also Explored These Related General Management Questions!