

Question: Construct a 90% confidence interval of the population proportion using the given information. x = 240, n = 300 Click here to view the table
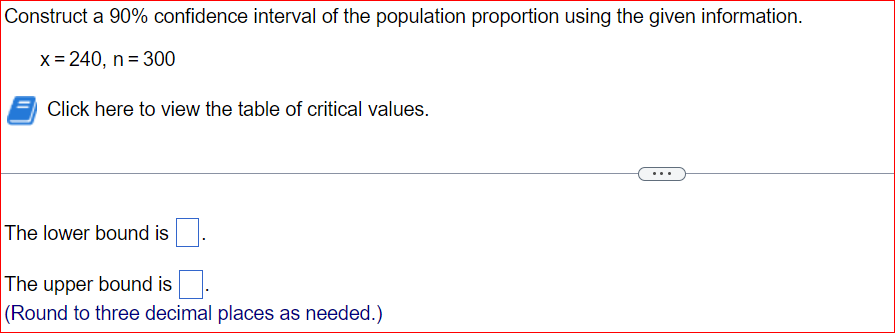
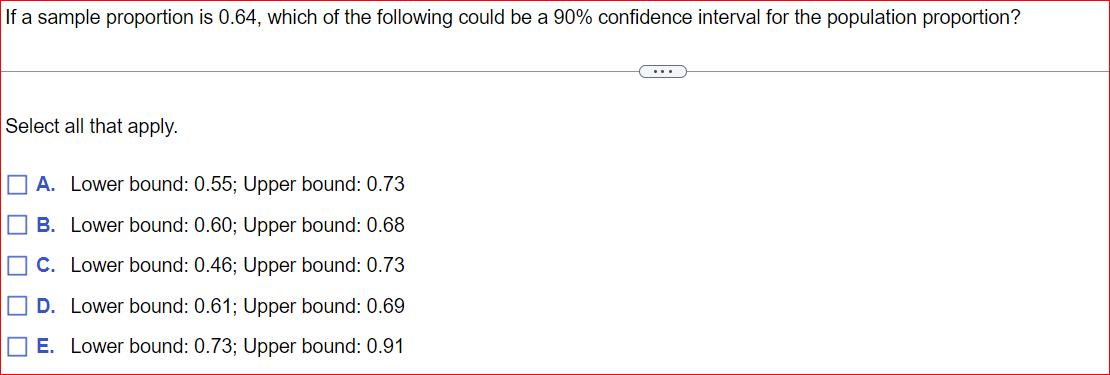
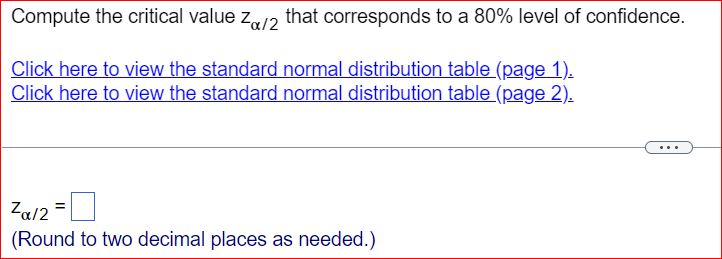
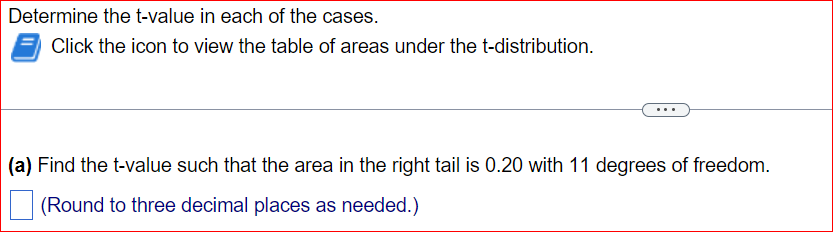
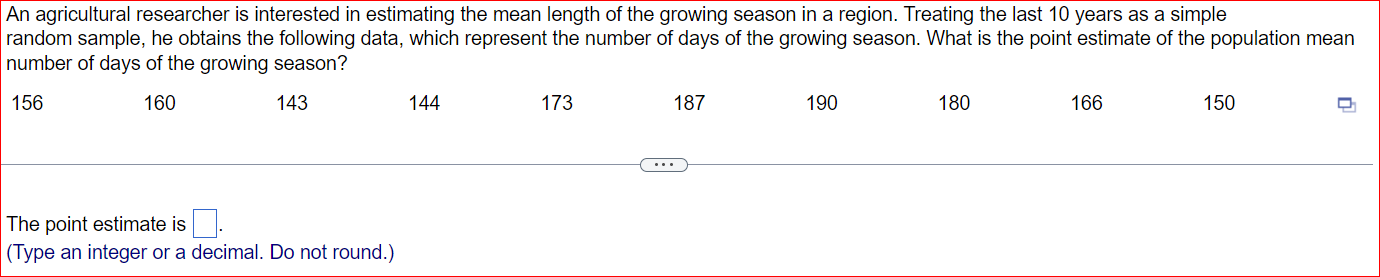
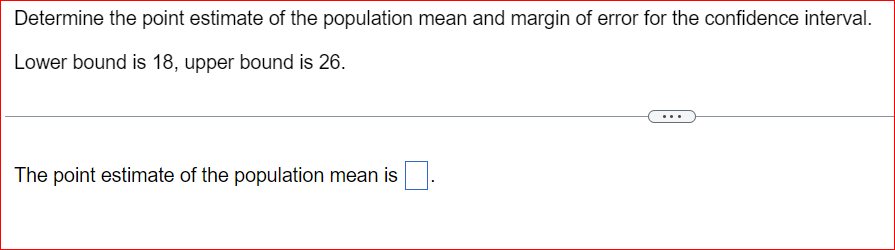
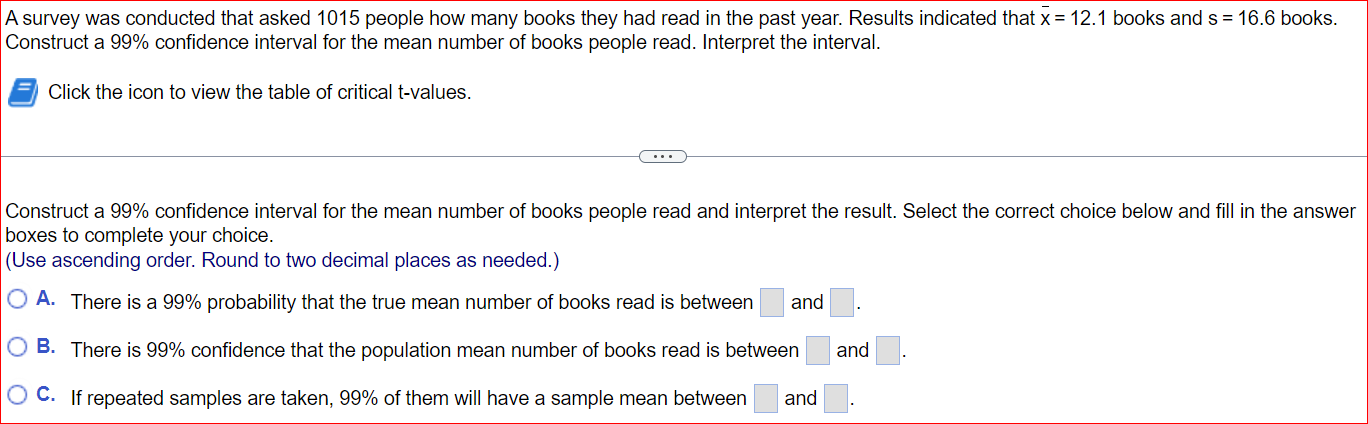
Construct a 90% confidence interval of the population proportion using the given information. x = 240, n = 300 Click here to view the table of critical values. The lower bound is The upper bound is (Round to three decimal places as needed.)If a sample proportion is 0.64, which of the following could be a 90% condence interval for the population proportion? Select all that apply. A. Lower bound: 0.55; Upper bound: 0.?3 B. Lower bound: 0.60; Upper bound: 0.68 _ C. Lower bound: 0.46; Upper bound: 0.?3 D. E. Lower bound: 0.61; Upper bound: 0.69 Lower bound: 0.73; Upper bound: 0.91 Compute the critical value 2m,2 that corresponds to a 80% level of condence. Click here to View the standard normal distribution table (page 1); Click here to View the standard normal distribution table (page 2); 20:12 = (Round to two decimal places as needed.) Determine the t-value in each of the cases. F Click the icon to view the table of areas under the t-distribution. (a) Find the t-value such that the area in the right tail is 0.20 with 11 degrees of freedom. (Round to three decimal places as needed.)An agricultural researcher is interested in estimating the mean length of the growing season in a region. Treating the last 10 years as a simple random sample, he obtains the following data, which represent the number of days of the growing season. What is the point estimate of the population mean number of days of the growing season? 156 160 143 144 173 187 190 180 166 150 . . . The point estimate is (Type an integer or a decimal. Do not round.)Determine the point estimate of the population mean and margin of error for the confidence interval. Lower bound is 18, upper bound is 26. The point estimate of the population mean isA survey was conducted that asked 1015 people how many books they had read in the past year. Results indicated that i: 12.1 books and 3 =16.6 books. Construct a 99% confidence interval tor the mean number of books people read. Interpret the interval. 5 Click the icon to view the table of critical t-values. Construct a 99% confidence interval tor the mean number of books people read and interpret the result. Select the correct choice below and fill in the answer boxes to complete your choice. (Use ascending order. Round to two decimal places as needed.) C? A- There is a 99% probability that the true mean number of books read is between and C3 3- There is 99% confidence that the population mean number of books read is between and C3 C- If repeated samples are taken, 99% of them will have a sample mean between and
Step by Step Solution
There are 3 Steps involved in it

Get step-by-step solutions from verified subject matter experts