

Question: Construct a 95% confidence interval of the population proportion using the given information. x=120, n=200 Click here to view the table of critical values. The
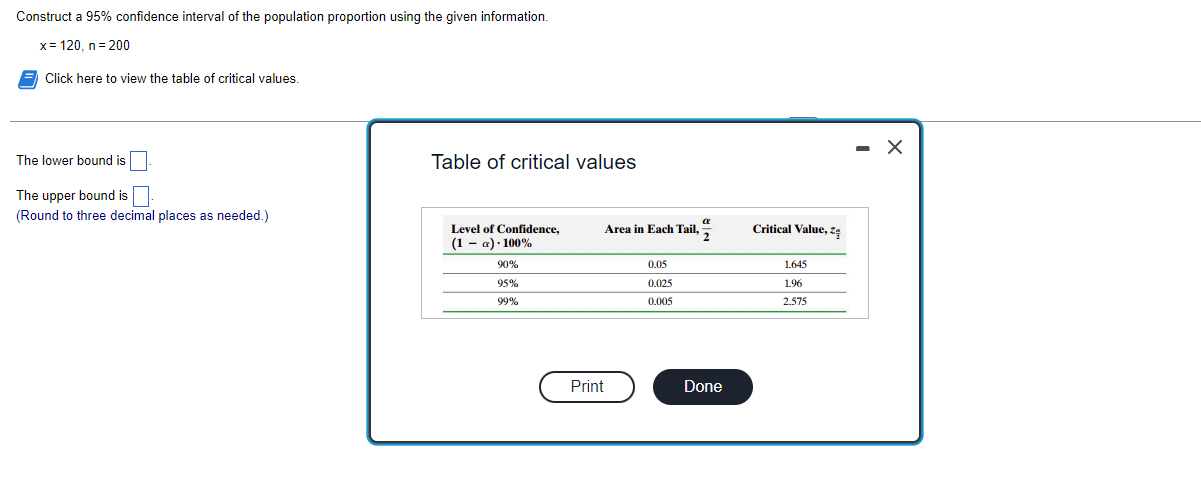
Construct a 95% confidence interval of the population proportion using the given information. x=120, n=200 Click here to view the table of critical values. The lower boundis | |- Table of critical values The upper bound is | | (Round to three decimal places as needed.) Level of Confidence, Areain Each Tail,% Critical Value, z= 1 o) -100% : W% 0.05 L645 954 . 196 2575
Step by Step Solution
There are 3 Steps involved in it
1 Expert Approved Answer
Step: 1 Unlock

Question Has Been Solved by an Expert!
Get step-by-step solutions from verified subject matter experts
Step: 2 Unlock
Step: 3 Unlock