

Question: construct a diagram to solve this With the following data, hand-trace the execution of the bank-line simulation that this chapter describes. Each line of data
construct a diagram to solve this
With the following data, hand-trace the execution of the bank-line simulation that this chapter describes. Each line of data contains an arrival time and a transaction time. Show the state of the queue and the event list at each step. 5 9 7 5 14 5 30 5 32 5 34 5
using this fig
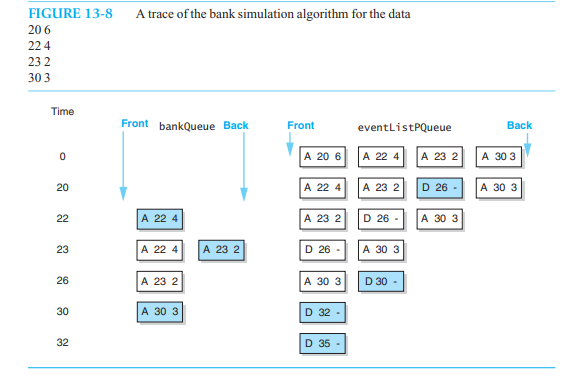
FIGURE 13-8 A trace of the bank simulation algorithm for the data 206 224 232 303 Time 22 A 224 23 A 224 A 232 D 26=4303 26 A 232 A 303 D 30= 30 A 303 D 32= 32 D 35=
Step by Step Solution
There are 3 Steps involved in it
1 Expert Approved Answer
Step: 1 Unlock

Question Has Been Solved by an Expert!
Get step-by-step solutions from verified subject matter experts
Step: 2 Unlock
Step: 3 Unlock