

Question: Construct a frequency distribution and a relative frequency histogram for the data set using five classes. Which class has the greatest relative frequency and which
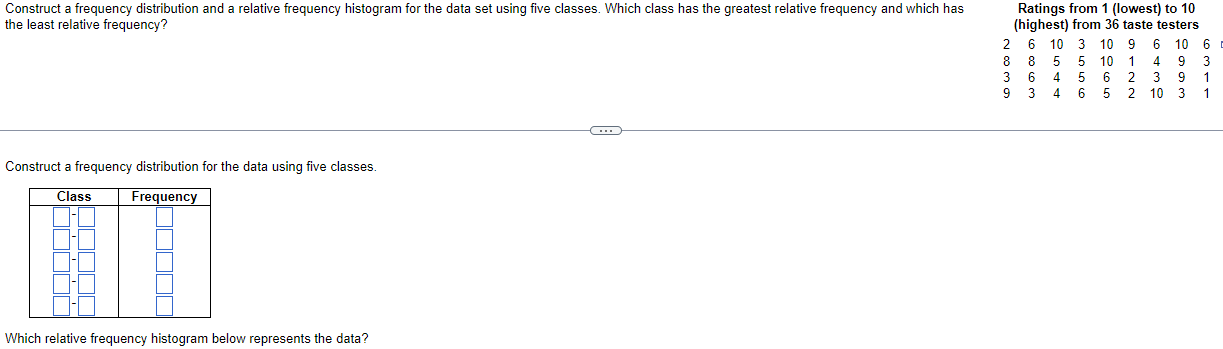
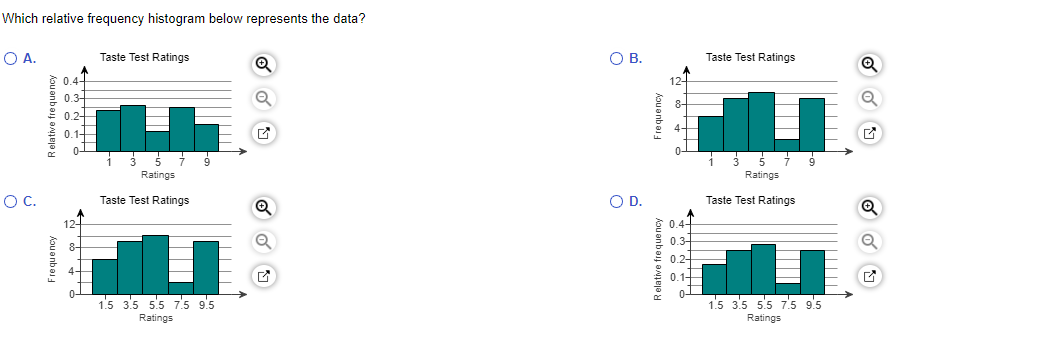
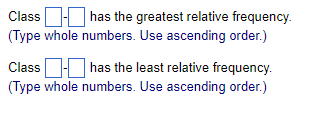
Construct a frequency distribution and a relative frequency histogram for the data set using five classes. Which class has the greatest relative frequency and which has Ratings from 1 (lowest) to 10 the least relative frequency? (highest) from 36 taste testers 6 10 3 10 6 10 10 Construct a frequency distribution for the data using five classes. Class Frequency Which relative frequency histogram below represents the data?Which relative frequency histogram below represents the data? O A. Taste Test Ratings O B. Taste Test Ratings 0.47 12- .3- Frequency Relative frequency 3 S 3 7 co- co- Ratings Ratings O C. Taste Test Ratings O O D. Taste Test Ratings 0.4- 0.3- Relative frequency Frequency 0. 15 35 5.5 75 95 15 35 5.5 75 95 Ratings RatingsClass has the greatest relative frequency. (Type whole numbers. Use ascending order.) Class has the least relative frequency. (Type whole numbers. Use ascending order.)
Step by Step Solution
There are 3 Steps involved in it

Get step-by-step solutions from verified subject matter experts