

Question: Construct a frequency distribution and has the greatest relative frequency and which has the least relative frequency? relative frequency histogram for the data set
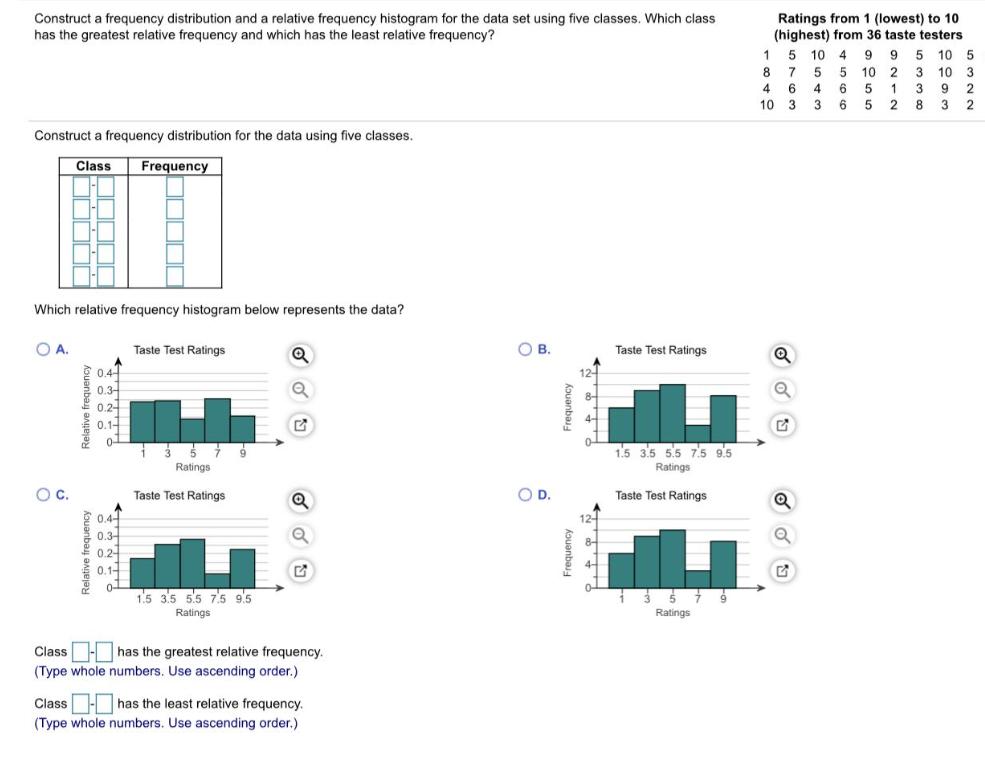
Construct a frequency distribution and has the greatest relative frequency and which has the least relative frequency? relative frequency histogram for the data set using five classes. Which class Ratings from 1 (lowest) to 10 (highest) from 36 taste testers 1 5 10 4 9 9 5 10 5 8 7 5 5 10 2 3 10 3 4 6 4 6 5 1 3 9 2 10 3 3 6 5 2 8 3 2 Construct a frequency distribution for the data using five classes. Class Frequency Which relative frequency histogram below represents the data? OA. Taste Test Ratings O B. Taste Test Ratings 0.4- 0.1- 1.5 3.5 5.5 75 95 Ratings Ratings Oc. Taste Test Ratings OD. Taste Test Ratings 0.4- 0.3- 0.24 0.14 15 35 55 75 9's Ratings Ratings Class-has the greatest relative frequency. (Type whole numbers. Use ascending order.) Class- has the least relative frequency. (Type whole numbers. Use ascending order.) kouanbas
Step by Step Solution
There are 3 Steps involved in it

Get step-by-step solutions from verified subject matter experts