

Question: Construct a graph (using quarterly data) of the Australian dollar against the Chinese Yuan (CNY) for the five-year period 1 July 2016 to 30 June
- Construct a graph (using quarterly data) of the Australian dollar against the Chinese Yuan (CNY) for the five-year period 1 July 2016 to 30 June 2020. For the month of July 2020 construct a daily graph
- Highlight on the graphs the major peaks and troughs in the value of the AUD against the Chinese Yuan (CNY).
- Discuss what caused each of the major peaks and troughs in the value of the Australian dollar against the Chinese Yuan (CNY). Ensure you include detailed research as part of your discussion. Whilst your research can come from a variety of sources, a requirement is that your research includes articles from the business press (The Australian Financial Review, for example) as articles in the business press will give a much fuller explanation of what is happening with exchange rates and why there are rises and falls.
- Predict and discuss what you think the value of the AUD against the Chinese Yuan (CNY) will be at 31 December 2020.
Quarterly Data:
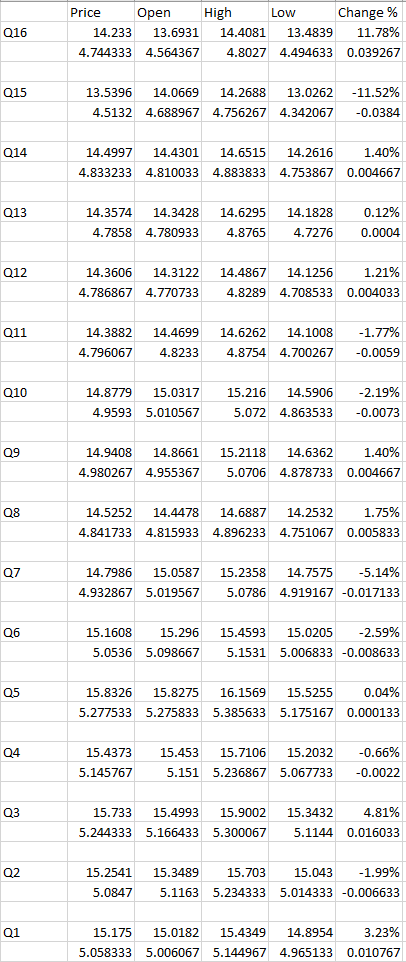
July data
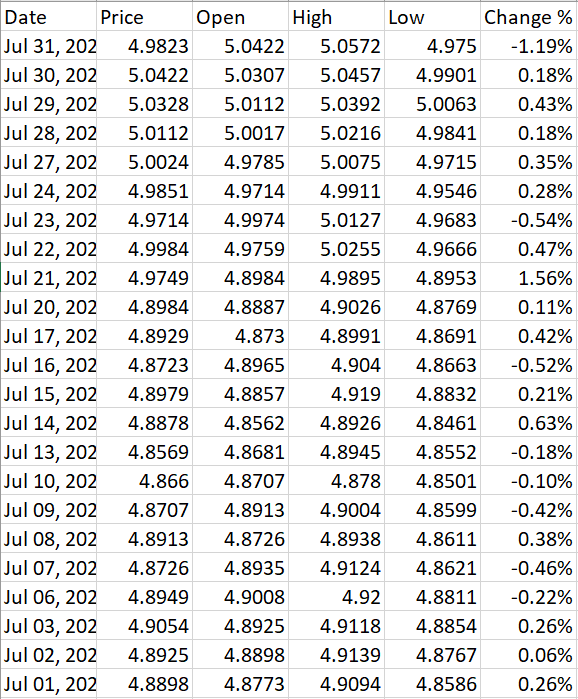
016 Price Open High Low Change % 14.233 13.6931 14.4081 13.4839 11.78% 4.744333 4.564367 4.8027 4.494633 0.039267 Q15 13.5396 14.0669 14.2688 13.0262 4.5132 4.688967 4.756267 4.342067 -11.52% -0.0384 Q14 14.4997 14.4301 14.6515 14.2616 1.40% 4.833233 4.810033 4.883833 4.753867 0.004667 Q13 14.3574 14.3428 4.7858 4.780933 14.6295 4.8765 14.1828 4.7276 0.12% 0.0004 Q12 14.3606 14.3122 4.786867 4.770733 14.4867 14.1256 1.21% 4.8289 4.708533 0.004033 Q11 -1.77% 14.3882 4.796067 14.4699 4.8233 14.6262 14.1008 4.8754 4.700267 -0.0059 Q10 14.8779 15.0317 4.9593 5.010567 15.216 14.5906 5.072 4.863533 -2.19% -0.0073 09 14.9408 14.8661 4.980267 4.955367 15.2118 14.6362 1.40% 5.0706 4.878733 4.878733 0.004667 Q8 14.5252 14.4478 14.6887 14.2532 1.75% 4.841733 4.815933 4.896233 4.751067 0.005833 Q7 14.7986 15.0587 4.932867 5.019567 15.2358 14.7575 -5.14% 5.0786 4.919167 -0.017133 Q6 15.1608 15.296 5.0536 5.098667 15.4593 15.0205 -2.59% 5.1531 5.006833 -0.008633 Q5 15.8326 15.8275 16.1569 15.5255 5.277533 5.275833 5.385633 5.175167 0.04% 0.000133 Q4 15.4373 -0.66% 15.453 15.7106 15.2032 5.151 5.236867 5.067733 5.145767 -0.0022 Q3 15.733 15.4993 15.9002 5.244333 5.166433 5.300067 15.3432 4.81% 5.1144 0.016033 Q2 15.2541 5.0847 15.3489 15.703 15.043 -1.99% 5.1163 5.234333 5.014333 -0.006633 01 15.175 15.0182 15.4349 14.8954 3.23% 5.058333 5.006067 5.144967 4.965133 0.010767 Date Price Open High Low Change % Jul 31, 202 4.9823 5.0422 5.0572 4.975 - 1.19% Jul 30, 202 5.0422 5.0307 5.0457 4.9901 0.18% Jul 29, 202 5.0328 5.0112 5.0392 5.0063 0.43% Jul 28, 202 5.0112 5.0017 5.0216 4.9841 0.18% Jul 27, 202 5.0024 4.9785 5.0075 4.9715 0.35% Jul 24, 202 4.9851 4.9714 4.9911 4.9546 0.28% Jul 23, 202 4.9714 4.9974 5.0127 4.9683 -0.54% Jul 22, 202 4.9984 4.9759 5.0255 4.9666 0.47% Jul 21, 202 4.9749 4.8984 4.9895 4.8953 1.56% Jul 20, 202 4.8984 4.8887 4.9026 4.8769 0.11% Jul 17, 202 4.8929 4.873 4.8991 4.8691 0.42% Jul 16, 202 4.8723 4.8965 4.904 4.8663 -0.52% Jul 15, 202 4.8979 4.8857 4.919 4.8832 0.21% Jul 14, 202 4.8878 4.8562 4.8926 4.8461 0.63% Jul 13, 202 4.8569 4.8681 4.8945 4.8552 -0.18% Jul 10, 202 4.866 4.8707 4.878 4.8501 -0.10% Jul 09, 202 4.8707 4.8913 4.9004 4.8599 -0.42% Jul 08, 202 4.8913 4.8726 4.8938 4.8611 0.38% Jul 07, 202 4.8726 4.8935 4.9124 4.8621 -0.46% Jul 06, 202 4.8949 4.9008 4.92 4.8811 -0.22% Jul 03, 202 4.9054 4.8925 4.9118 4.8854 0.26% Jul 02, 202 4.8925 4.8898 4.9139 4.8767 0.06% Jul 01, 202 4.8898 4.8773 4.9094 4.8586 0.26% 016 Price Open High Low Change % 14.233 13.6931 14.4081 13.4839 11.78% 4.744333 4.564367 4.8027 4.494633 0.039267 Q15 13.5396 14.0669 14.2688 13.0262 4.5132 4.688967 4.756267 4.342067 -11.52% -0.0384 Q14 14.4997 14.4301 14.6515 14.2616 1.40% 4.833233 4.810033 4.883833 4.753867 0.004667 Q13 14.3574 14.3428 4.7858 4.780933 14.6295 4.8765 14.1828 4.7276 0.12% 0.0004 Q12 14.3606 14.3122 4.786867 4.770733 14.4867 14.1256 1.21% 4.8289 4.708533 0.004033 Q11 -1.77% 14.3882 4.796067 14.4699 4.8233 14.6262 14.1008 4.8754 4.700267 -0.0059 Q10 14.8779 15.0317 4.9593 5.010567 15.216 14.5906 5.072 4.863533 -2.19% -0.0073 09 14.9408 14.8661 4.980267 4.955367 15.2118 14.6362 1.40% 5.0706 4.878733 4.878733 0.004667 Q8 14.5252 14.4478 14.6887 14.2532 1.75% 4.841733 4.815933 4.896233 4.751067 0.005833 Q7 14.7986 15.0587 4.932867 5.019567 15.2358 14.7575 -5.14% 5.0786 4.919167 -0.017133 Q6 15.1608 15.296 5.0536 5.098667 15.4593 15.0205 -2.59% 5.1531 5.006833 -0.008633 Q5 15.8326 15.8275 16.1569 15.5255 5.277533 5.275833 5.385633 5.175167 0.04% 0.000133 Q4 15.4373 -0.66% 15.453 15.7106 15.2032 5.151 5.236867 5.067733 5.145767 -0.0022 Q3 15.733 15.4993 15.9002 5.244333 5.166433 5.300067 15.3432 4.81% 5.1144 0.016033 Q2 15.2541 5.0847 15.3489 15.703 15.043 -1.99% 5.1163 5.234333 5.014333 -0.006633 01 15.175 15.0182 15.4349 14.8954 3.23% 5.058333 5.006067 5.144967 4.965133 0.010767 Date Price Open High Low Change % Jul 31, 202 4.9823 5.0422 5.0572 4.975 - 1.19% Jul 30, 202 5.0422 5.0307 5.0457 4.9901 0.18% Jul 29, 202 5.0328 5.0112 5.0392 5.0063 0.43% Jul 28, 202 5.0112 5.0017 5.0216 4.9841 0.18% Jul 27, 202 5.0024 4.9785 5.0075 4.9715 0.35% Jul 24, 202 4.9851 4.9714 4.9911 4.9546 0.28% Jul 23, 202 4.9714 4.9974 5.0127 4.9683 -0.54% Jul 22, 202 4.9984 4.9759 5.0255 4.9666 0.47% Jul 21, 202 4.9749 4.8984 4.9895 4.8953 1.56% Jul 20, 202 4.8984 4.8887 4.9026 4.8769 0.11% Jul 17, 202 4.8929 4.873 4.8991 4.8691 0.42% Jul 16, 202 4.8723 4.8965 4.904 4.8663 -0.52% Jul 15, 202 4.8979 4.8857 4.919 4.8832 0.21% Jul 14, 202 4.8878 4.8562 4.8926 4.8461 0.63% Jul 13, 202 4.8569 4.8681 4.8945 4.8552 -0.18% Jul 10, 202 4.866 4.8707 4.878 4.8501 -0.10% Jul 09, 202 4.8707 4.8913 4.9004 4.8599 -0.42% Jul 08, 202 4.8913 4.8726 4.8938 4.8611 0.38% Jul 07, 202 4.8726 4.8935 4.9124 4.8621 -0.46% Jul 06, 202 4.8949 4.9008 4.92 4.8811 -0.22% Jul 03, 202 4.9054 4.8925 4.9118 4.8854 0.26% Jul 02, 202 4.8925 4.8898 4.9139 4.8767 0.06% Jul 01, 202 4.8898 4.8773 4.9094 4.8586 0.26%
Step by Step Solution
There are 3 Steps involved in it

Get step-by-step solutions from verified subject matter experts