

Question: Construct a histogram from the frequency distribution. Does the result appear to approximate a normal distribution? Why or why not? Voltage (Volt) Frequency 123.3-123.4 10
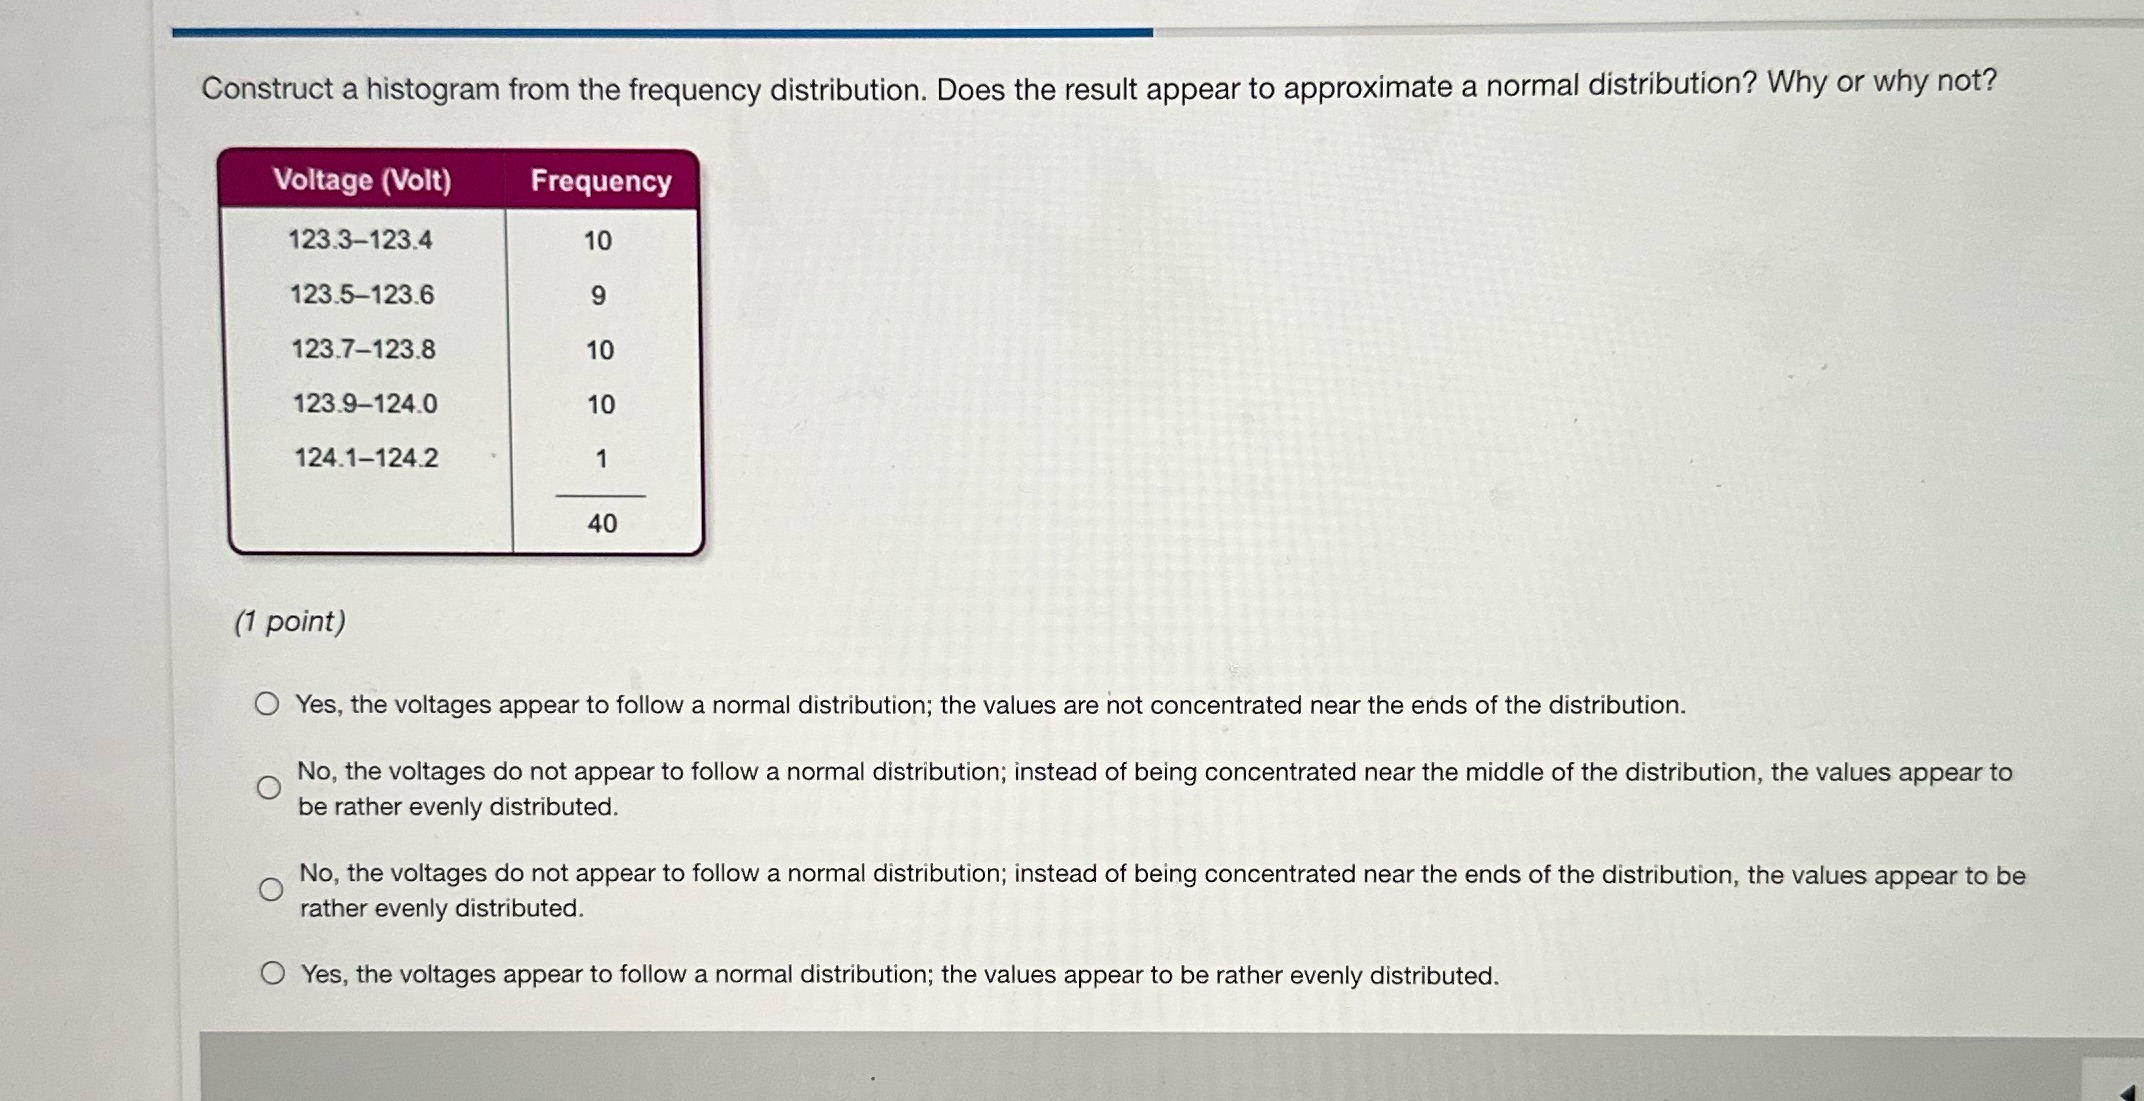
Construct a histogram from the frequency distribution. Does the result appear to approximate a normal distribution? Why or why not? Voltage (Volt) Frequency 123.3-123.4 10 123.5-123.6 9 123.7-123.8 10 123.9-124.0 10 124.1-124.2 40 (1 point) O Yes, the voltages appear to follow a normal distribution; the values are not concentrated near the ends of the distribution. O No, the voltages do not appear to follow a normal distribution; instead of being concentrated near the middle of the distribution, the values appear to be rather evenly distributed. O No, the voltages do not appear to follow a normal distribution; instead of being concentrated near the ends of the distribution, the values appear to be rather evenly distributed. O Yes, the voltages appear to follow a normal distribution; the values appear to be rather evenly distributed
Step by Step Solution
There are 3 Steps involved in it

Get step-by-step solutions from verified subject matter experts