

Question: Construct a hypothesis test bell curve with a shaded region in python. Use matplotlib and other familiar functions to construct this. Illustrate the z score,
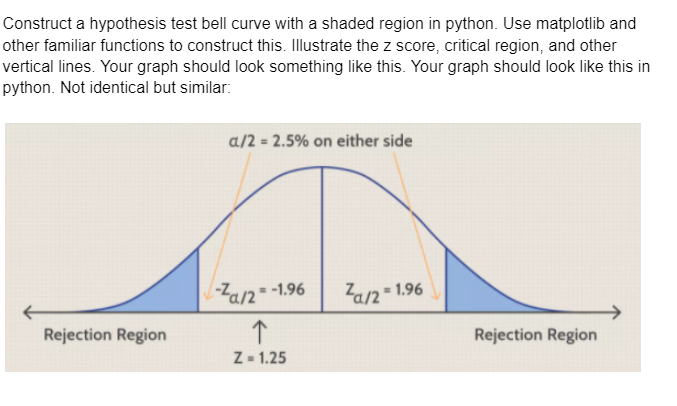
Construct a hypothesis test bell curve with a shaded region in python. Use matplotlib and other familiar functions to construct this. Illustrate the z score, critical region, and other vertical lines. Your graph should look something like this. Your graph should look like this in python. Not identical but similar
Step by Step Solution
There are 3 Steps involved in it
1 Expert Approved Answer
Step: 1 Unlock

Question Has Been Solved by an Expert!
Get step-by-step solutions from verified subject matter experts
Step: 2 Unlock
Step: 3 Unlock