

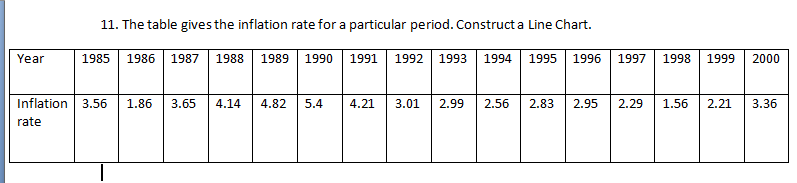
Question: Construct a line chart: 11. The table gives the inflation rate for a particular period. Construct a Line Chart. Year 1985 1986 1987 1989 1990
Construct a line chart:
Step by Step Solution
There are 3 Steps involved in it
1 Expert Approved Answer
Step: 1 Unlock

Question Has Been Solved by an Expert!
Get step-by-step solutions from verified subject matter experts
Step: 2 Unlock
Step: 3 Unlock