

Question: Construct a mean and range chart in Excel using the data attached. The mean of the overall process is 16 and the standard deviation is
Construct a mean and range chart in Excel using the data attached. The mean of the overall process is 16 and the standard deviation is 4. Perform a median run test on each of the control charts to identify if there are any non-random patterns occurring in the process. Attach the control charts clearly showing the control limits, the mean and the data points. There is no need to show the underlying data. Make sure the charts are not split across multiple pages. Determine if the process is in control using 1.96 as the acceptable range. Support your answer. 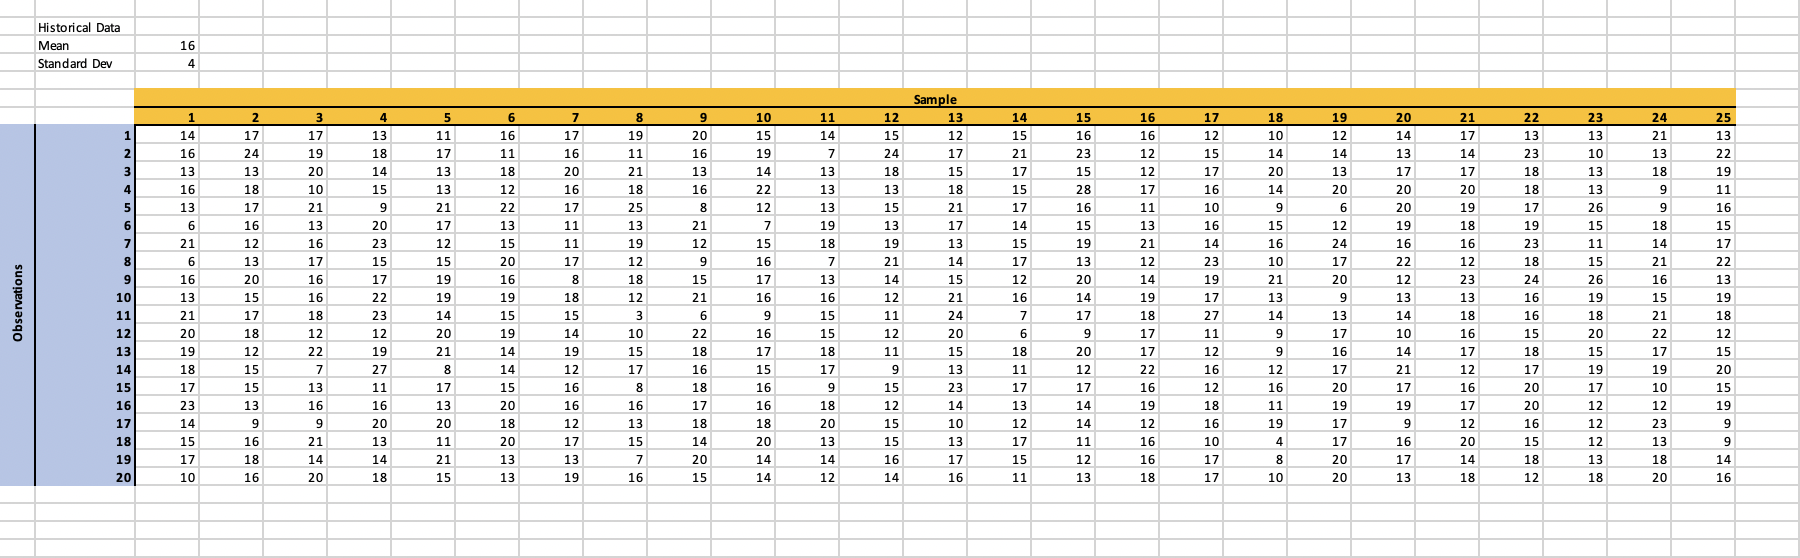
Step by Step Solution
There are 3 Steps involved in it
1 Expert Approved Answer
Step: 1 Unlock

Question Has Been Solved by an Expert!
Get step-by-step solutions from verified subject matter experts
Step: 2 Unlock
Step: 3 Unlock