

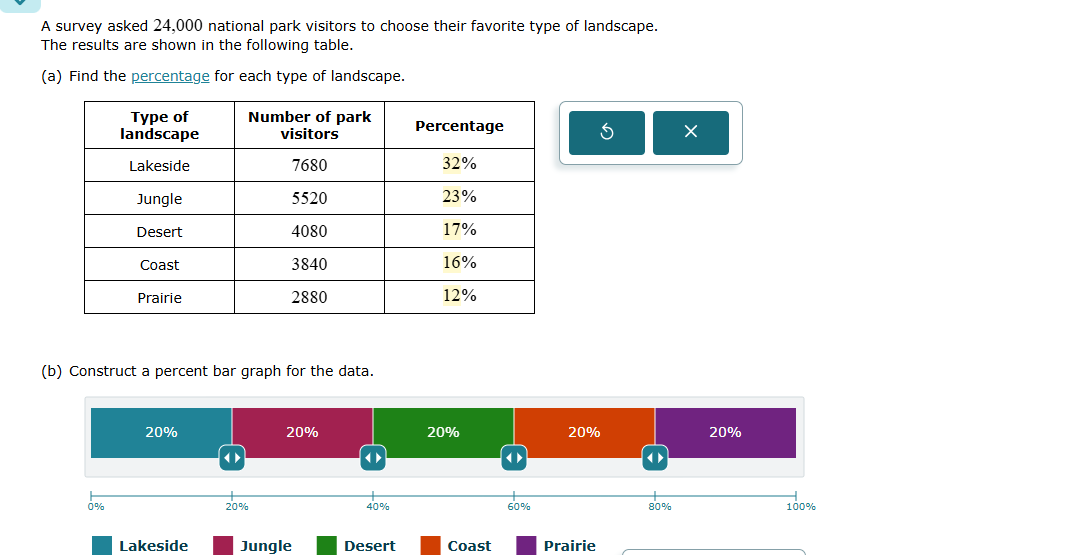
Question: Construct a percent bar graph for the data. A survey asked 24,000 national park visitors to choose their favorite type of landscape. The results are
Construct a percent bar graph for the data.
Step by Step Solution
There are 3 Steps involved in it
1 Expert Approved Answer
Step: 1 Unlock

Question Has Been Solved by an Expert!
Get step-by-step solutions from verified subject matter experts
Step: 2 Unlock
Step: 3 Unlock