

Question: Construct a PERT/CPM chart based on the table below. Determine the critical path. Use the Most Likely Time as the duration for each activity. Ignore
Construct a PERT/CPM chart based on the table below. Determine the critical path.
Use the "Most Likely Time" as the duration for each activity. Ignore the "Most Optimistic Time" and the "Most Pessimistic Time".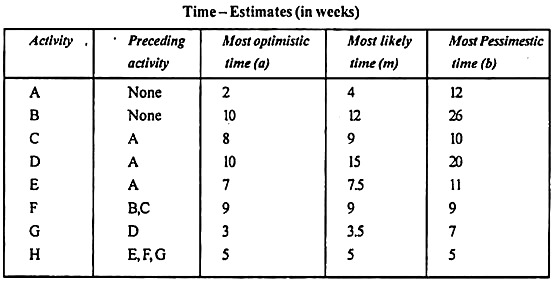
Step by Step Solution
There are 3 Steps involved in it
1 Expert Approved Answer
Step: 1 Unlock

Question Has Been Solved by an Expert!
Get step-by-step solutions from verified subject matter experts
Step: 2 Unlock
Step: 3 Unlock