

Question: Construct a scatter-plot of the money spent on higher education versus the year.Be sure to put the explanatory variable on the horizontal axis.Be sure to
- Construct a scatter-plot of the money spent on higher education versus the year.Be sure to put the
explanatory variable on the horizontal axis.Be sure to label each axis and include appropriate units of scale.If the data appear to follow a linear model, draw the regression line (line of best fit.)If the data appear to follow an exponential model, draw the regression curve (curve of best fit.)Include this graph in your report.
2.Find the equation for the line or curve of best fit that you drew on the graph in question #1.Use
this equation to predict the amount of money North Dakota will budget for higher education in
2020.In your report, discuss at least two reasons why this prediction may not turn out to be accurate.
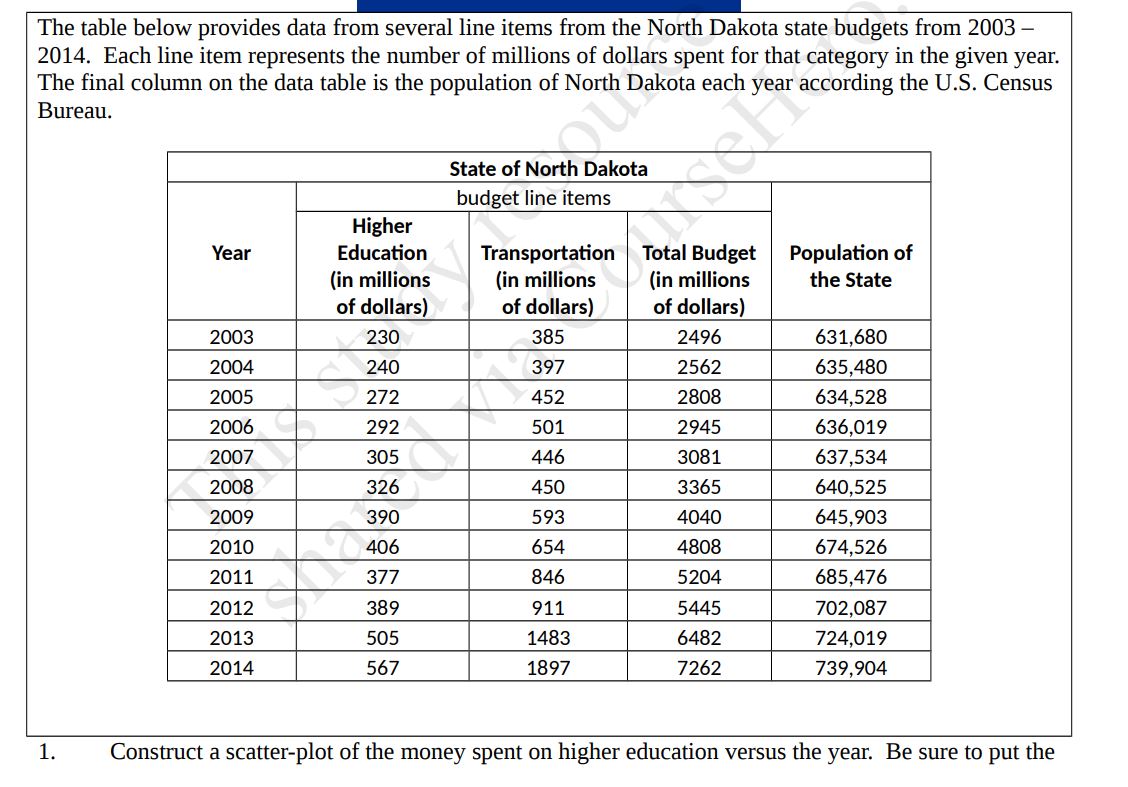
Bureau. Year 2003 2004 2005 2006 2007 2008 2009 2010 201 1 2012 2013 2014 1. Construct a scatter-plot of the money spent on higher education versus the year. Be sure to put the The table below provides data from several line items from the North Dakota state budgets from 2003 2014. Each line item represents the number of millions of dollars spent for that category in the given year. The nal column on the data table is the pepulation of North Dakota each year according the US. Census Higher Education (in millions of dollars} 230 240 272 292 305 326 390 406 377 389 505 567 State of North Dakota budget line items Transportation Total Budget Population of {in millions (in millions the State of dollars) of dollars} 397 2562 635,480 501 2945 636,019 846 5204 685,476 911 5445 702,087 1483 6482 724,019 1897 7262 739,904
Step by Step Solution
There are 3 Steps involved in it

Get step-by-step solutions from verified subject matter experts