

Question: construct a time diagram that represents the cash flows Years 0 1 2 3 4 5 Cash Flow -P $0 $0 $1,000 $2,000 $3,000
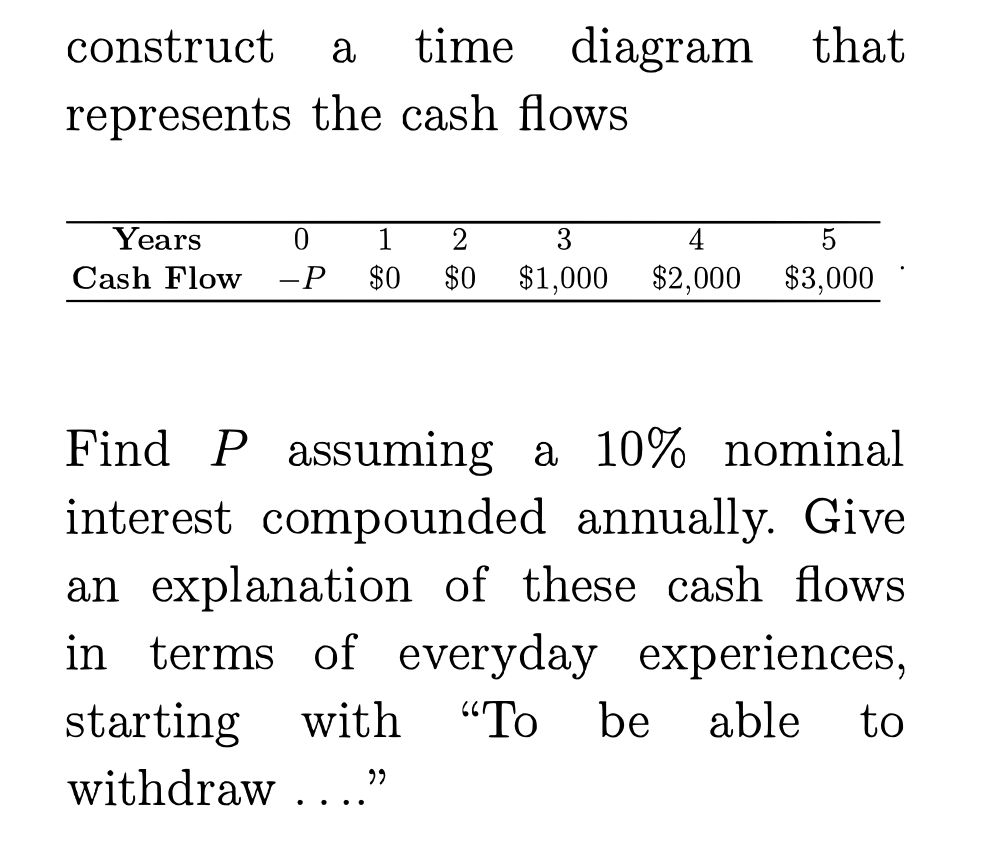
construct a time diagram that represents the cash flows Years 0 1 2 3 4 5 Cash Flow -P $0 $0 $1,000 $2,000 $3,000 Find Passuming a 10% nominal interest compounded annually. Give an explanation of these cash flows. in terms of everyday experiences, starting with "To be able to withdraw
Step by Step Solution
There are 3 Steps involved in it
1 Expert Approved Answer
Step: 1 Unlock

Question Has Been Solved by an Expert!
Get step-by-step solutions from verified subject matter experts
Step: 2 Unlock
Step: 3 Unlock