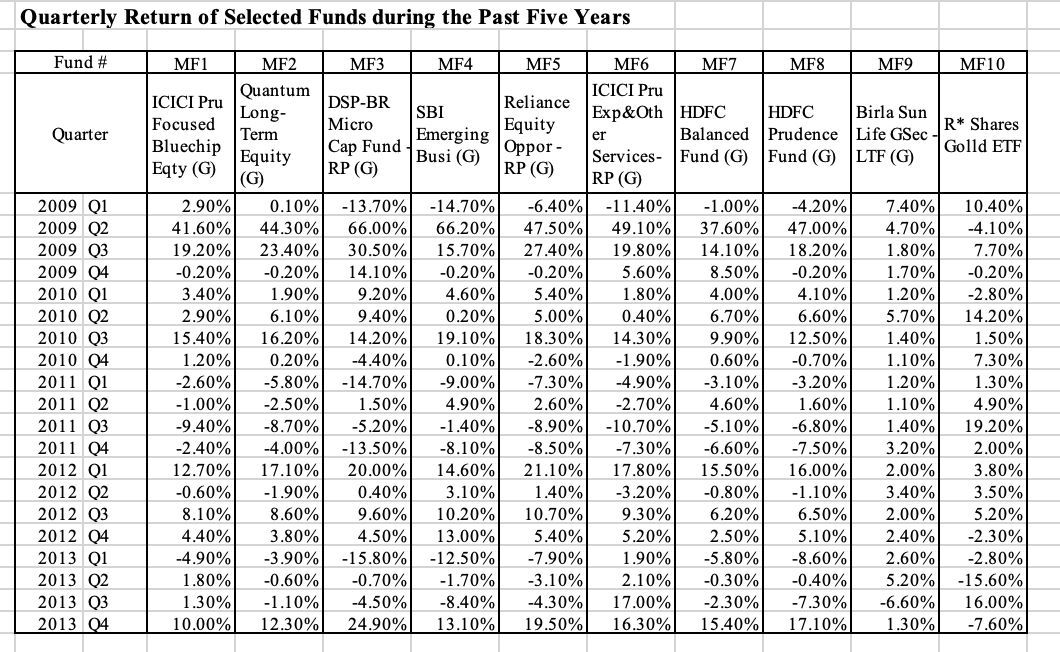
Question: Construct a two assets portfolio that combines the two funds with the lowest correlation at different weights. Explain the shape of the line that connects

  • Construct a two assets portfolio that combines the two funds with the lowest correlation at different weights. Explain the shape of the line that connects all sets of portfolios.
  • If the two lines demonstrated in the previous two points are not similar, explain the reasons behind this difference.
  • Construct a covariance matrix. Based on that, you have to build a multiple asset portfolio, that includes all 10 funds. How can you reach the optimal risky portfolio? Noting that the risk-free rate is 8%.
  • Analyze the effect of adding risk-free asset to your risky investments.
Construct a two assets portfolio that combines
Quarterly Return of Selected Funds during the Past Five Years Fund # MF1 MF2 MF3 MF4 MF5 MF6 MF7 MF8 MF9 MF10 Quantum ICICI Pru ICICI Pru DSP-BR Reliance Long- SBI Exp&Oth HDFC HDFC Birla Sun Focused Micro Equity Term er Balanced Prudence Life GSec - R* Shares Quarter Golld ETF Equity Cap Fund Emerging Bluechip Busi (G) Oppor - Services- Fund (G) Fund (G) LTF (G) Eqty (G) RP (G) RP (G) (G RP (G) 2009 Q1 2.90% 0.10% -13.70% -14.70% -6.40% -11.40% -1.00% -4.20% 7.40% 10.40% 2009 Q2 41.60% 44.30% 66.00% 66.20% 47.50% 49.10% 37.60% 47.00% 4.70% -4.10% 2009 Q3 19.20% 23.40% 30.50% 15.70% 27.40% 19.80% 14.10% 18.20% 1.80% 7.70% 2009 Q4 -0.20% -0.20% 14.10% -0.20% -0.20% 5.60% 8.50% -0.20% 1.70% -0.20% 2010 Q1 3.40% 1.90% 9.20% 4.60% 5.40% 1.80% 4.00% 4.10% 1.20% -2.80% 2010 Q2 2.90% 6.10% 9.40% 0.20% 5.00% 0.40% 6.70% 6.60% 5.70% 14.20% 2010 Q3 15.40% 16.20% 14.20% 19.10% 18.30% 14.30% 9.90% 12.50% 1.40% 1.50% 2010 Q4 1.20% 0.20% -4.40% 0.10% -2.60% -1.90% 0.60% -0.70% 1.10% 7.30% 2011 Q1 -2.60% -5.80% -14.70% -9.00% -7.30% -4.90% -3.10% -3.20% 1.20% 1.30% 2011 Q2 -1.00% -2.50% 1.50% 4.90% 2.60% -2.70% 4.60% 1.60% 1.10% 4.90% 2011 Q3 -9.40% -8.70% -5.20% -1.40% -8.90% -10.70% -5.10% -6.80% 1.40% 19.20% 2011 Q4 -2.40% -4.00% -13.50% -8.10% -8.50% -7.30% -6.60% -7.50% 3.20% 2.00% 2012 Q1 12.70% 17.10% 20.00% 14.60% 21.10% 17.80% 15.50% 16.00% 2.00% 3.80% 2012 Q2 -0.60% -1.90% 0.40% 3.10% 1.40% -3.20% -0.80% -1.10% 3.40% 3.50% 2012 Q3 8.10% 8.60% 9.60% 10.20% 10.70% 9.30% 6.20% 6.50% 2.00% 5.20% 2012 04 4.40% 3.80% 4.50% 13.00% 5.40% 5.20% 2.50% 5.10% 2.40% -2.30% 2013 Q1 -4.90% -3.90% -15.80% -12.50% -7.90% 1.90% -5.80% -8.60% 2.60% -2.80% 2013 Q2 1.80% -0.60% -0.70% -1.70% -3.10% 2.10% -0.30% -0.40% 5.20% -15.60% 2013 Q3 1.30% -1.10% -4.50% -8.40% -4.30% 17.00% -2.30% -7.30% -6.60% 16.00% 2013 04 10.00% 12.30% 24.90% 13.10% 19.50% 16.30% 15.40% 17.10% 1.30% -7.60%

Step by Step Solution

There are 3 Steps involved in it

1 Expert Approved Answer
Step: 1 Unlock blur-text-image
Question Has Been Solved by an Expert!

Get step-by-step solutions from verified subject matter experts

Step: 2 Unlock
Step: 3 Unlock

Students Have Also Explored These Related Finance Questions!