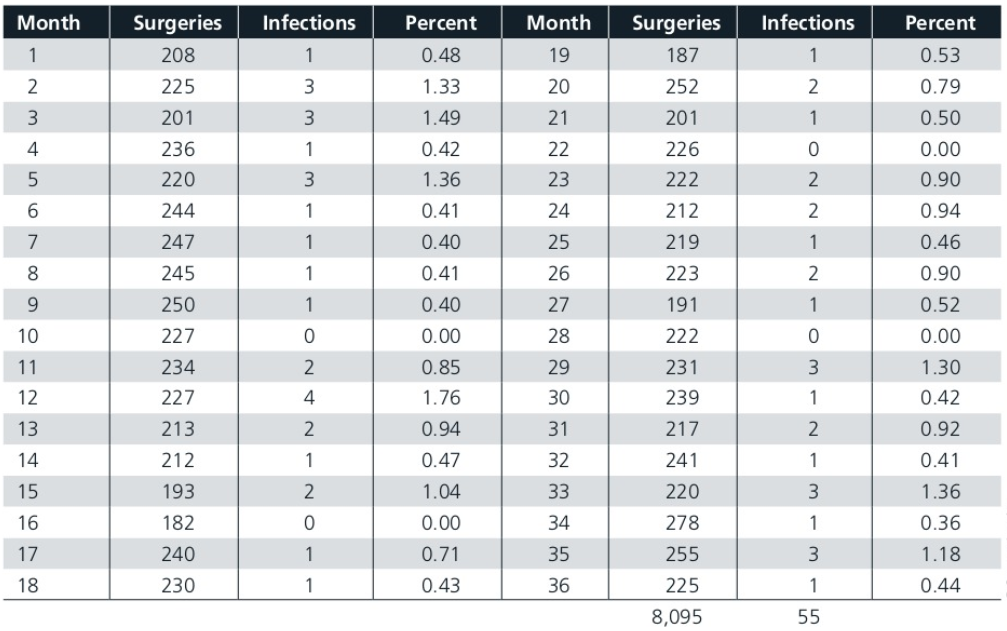
Question: Construct an appropriate control chart, compute the upper and lower control limits, plot the data on a control chart, and determine if the process is

Construct an appropriate control chart, compute the upper and lower control limits, plot the data on a control chart, and determine if the process is in statistical control. Based on your analysis, what action, if any, should management take? (PLEASE ANSWER WITH EXCEL)

Construct an appropriate control chart, compute

Month Infections Month Infections Percent Percent 0.48 1 1 19 Surgeries 187 252 1 Surgeries 208 225 201 0.53 3 1.33 2 20 21 3 1.49 201 1 0.79 0.50 0.00 1 0 236 220 0.42 1.36 22 23 226 222 3 2 0.90 244 1 0.41 24 212 2 1 0.40 219 1 1 2 1 o ao =ooo vou awn 247 245 250 227 234 227 1 0 25 26 27 28 29 0.41 0.40 0.00 0.85 1.76 0.94 223 191 222 231 0.94 0.46 0.90 0.52 0.00 1.30 0.42 0.92 0 11 2 3 12 4. 239 1 30 31 213 2. 217 2 1 0.47 241 1 212 193 32 33 2 1.04 220 3 16 182 0 0.00 278 1 o - - 0.41 1.36 0.36 1.18 0.44 240 230 34 35 36 3 0.71 0.43 18 1 255 225 8,095 1 55

Step by Step Solution

There are 3 Steps involved in it

1 Expert Approved Answer
Step: 1 Unlock blur-text-image
Question Has Been Solved by an Expert!

Get step-by-step solutions from verified subject matter experts

Step: 2 Unlock
Step: 3 Unlock

Students Have Also Explored These Related General Management Questions!