

Question: Construct an influence chart for the problem Example of a Influence Chart : Howard's Apple Farm makes applesauce and apple juice from their apples. It
Construct an influence chart for the problem
Example of a Influence Chart :
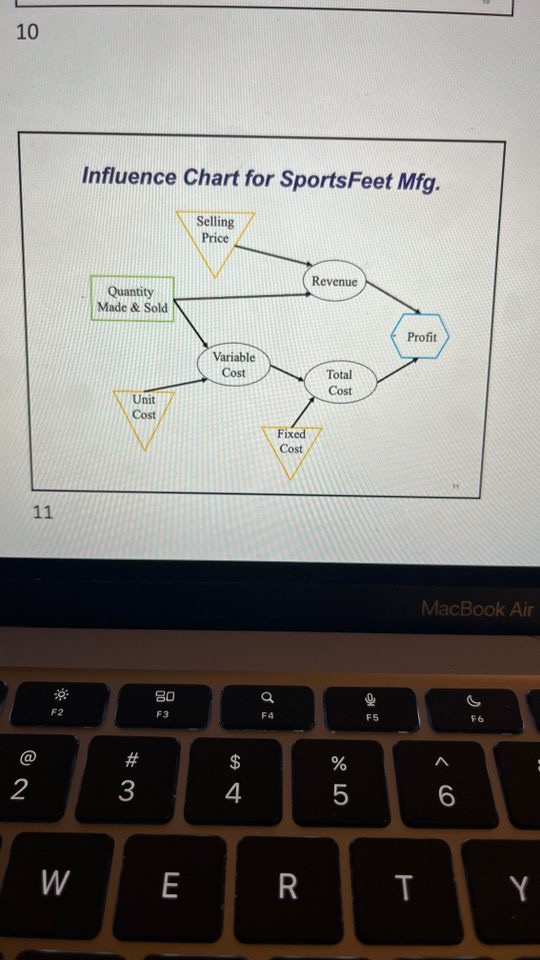
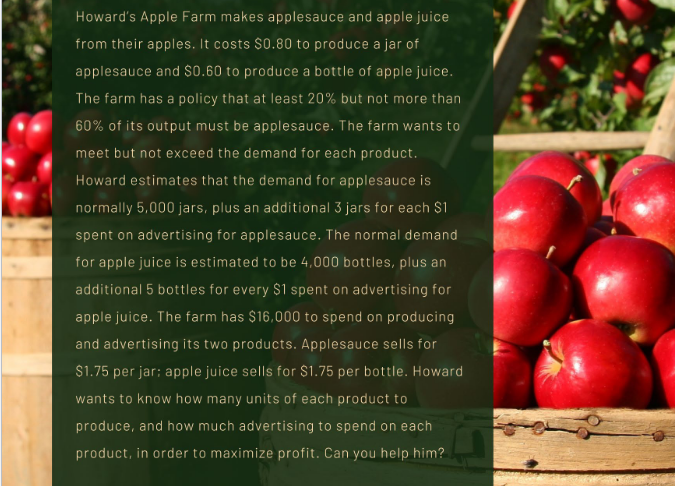
Howard's Apple Farm makes applesauce and apple juice from their apples. It costs $0.80 to produce a jar of applesauce and $0.60 to produce a bottle of apple juice. The farm has a policy that at least 20% but not more than 60% of its output must be applesauce. The farm wants to meet but not exceed the demand for each product. Howard estimates that the demand for applesauce is normally 5,000 jars, plus an additional 3 jars for each $1 spent on advertising for applesauce. The normal demand for apple juice is estimated to be 4,000 bottles, plus an additional 5 bottles for every $1 spent on advertising for apple juice. The farm has $16,000 to spend on producing and advertising its two products. Applesauce sells for $1.75 per jar; apple juice sells for $1.75 per bottle. Howard wants to know how many units of each product to produce, and how much advertising to spend on each product, in order to maximize profit. Can you help him? Influence Chart for SportsFeet Mfg
Step by Step Solution
There are 3 Steps involved in it

Get step-by-step solutions from verified subject matter experts