

Question: Construct an X chart R chart for the following data set. (Leave no cells blank - be certain to enter 0 wherever rec
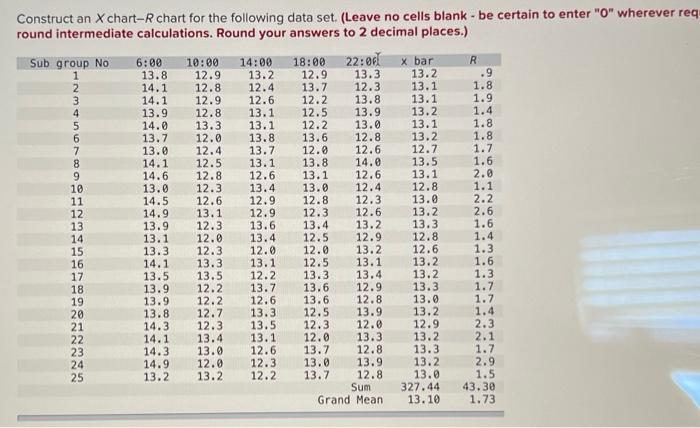
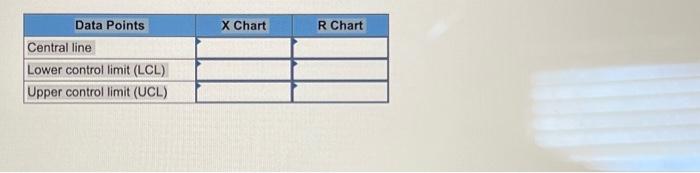
Construct an X chart R chart for the following data set. (Leave no cells blank - be certain to enter " 0 " wherever rec round intermediate calculations. Round your answers to 2 decimal places.) \begin{tabular}{|l|l|l|} \hline \multicolumn{1}{|c|}{ Data Points } & X Chart & R Chart \\ \hline Central line & & \\ \hline Lower control limit (LCL) & & \\ \hline Upper control limit (UCL) & & \\ \hline \end{tabular}
Step by Step Solution
There are 3 Steps involved in it
1 Expert Approved Answer
Step: 1 Unlock

Question Has Been Solved by an Expert!
Get step-by-step solutions from verified subject matter experts
Step: 2 Unlock
Step: 3 Unlock