

Question: Construct ann Rchart and x-bar chart. What is the UCL for the R chart? what is the LCL for the x-bar chart? which if the
Construct ann Rchart and x-bar chart.
Observation 1 2 3 Sample 1 37 55 56 4 64 50 12 47 3 45 87 78 78 43 80 89 89 59 67 4 69 5 67 26 54
What is the UCL for the R chart?
what is the LCL for the x-bar chart?
which if the following is correct?
a) r is out of control
b) both are in control
c) x bar is not in control
d) neither is in control 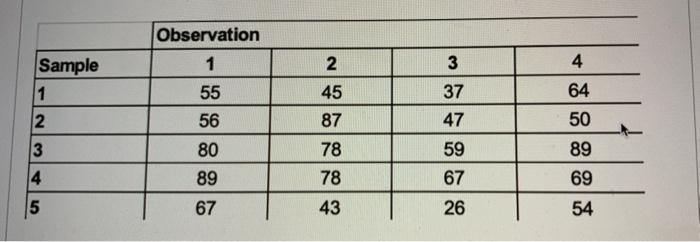
Step by Step Solution
There are 3 Steps involved in it
1 Expert Approved Answer
Step: 1 Unlock

Question Has Been Solved by an Expert!
Get step-by-step solutions from verified subject matter experts
Step: 2 Unlock
Step: 3 Unlock