

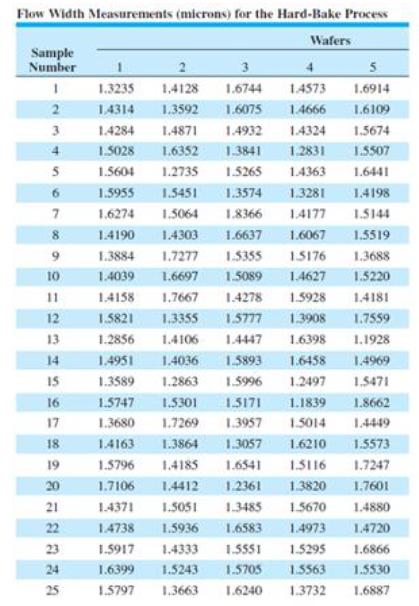
The below table provides the wafer measurements for 25 samples. a. Construct appropriate control charts with details
Fantastic news! We've Found the answer you've been seeking!
Question:
The below table provides the wafer measurements for 25 samples.
a. Construct appropriate control charts with details calculations and conclusion?
b. If the wafer specifications are 1.50+/-0.5 microns, what percentage of product will be nonconforming products?
c. Based on Process Capability Measure, what will be your conclusions?
d. What is the probability of detecting a shift to µ1=µ0+2?
Expert Answer:
Calculate the X and R for the given data as shown below Exm6 1Samp Exm6 1x5 16914 16109 15674 15507 ... View the full answer

Related Book For 

Introduction to Statistical Quality Control
ISBN: 978-1118146811
7th edition
Authors: Douglas C Montgomery
Posted Date:
