

Question: Construct (Graph) a range chart for the length in centimeters of a part from the following table. (All your data should be rounded to 3
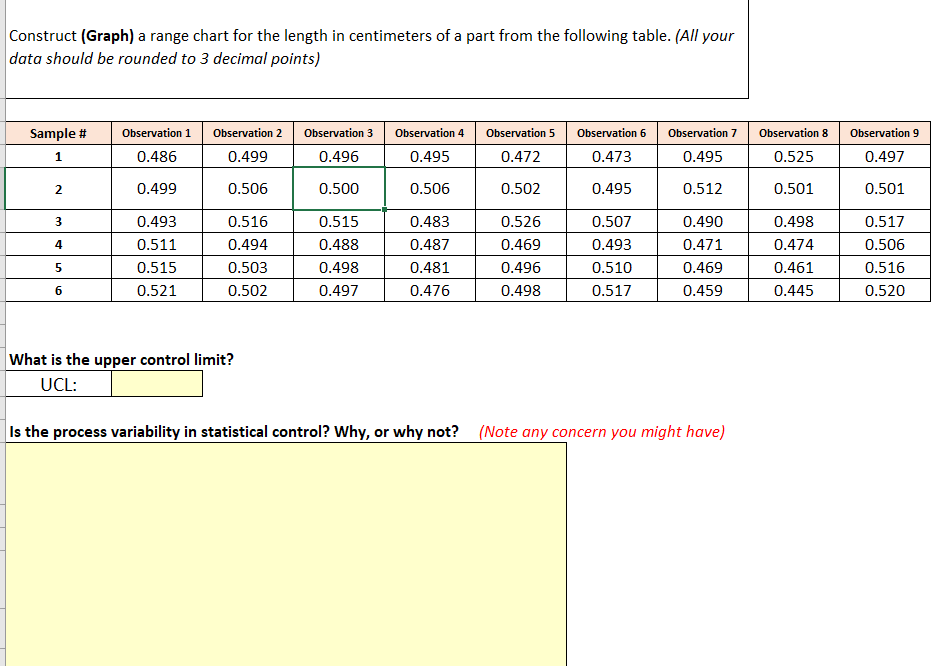
Construct (Graph) a range chart for the length in centimeters of a part from the following table. (All your data should be rounded to 3 decimal points) What is the upper control limit? Is the process variability in statistical control? Why, or why not? (Note any concern you might have)
Step by Step Solution
There are 3 Steps involved in it
1 Expert Approved Answer
Step: 1 Unlock

Question Has Been Solved by an Expert!
Get step-by-step solutions from verified subject matter experts
Step: 2 Unlock
Step: 3 Unlock