

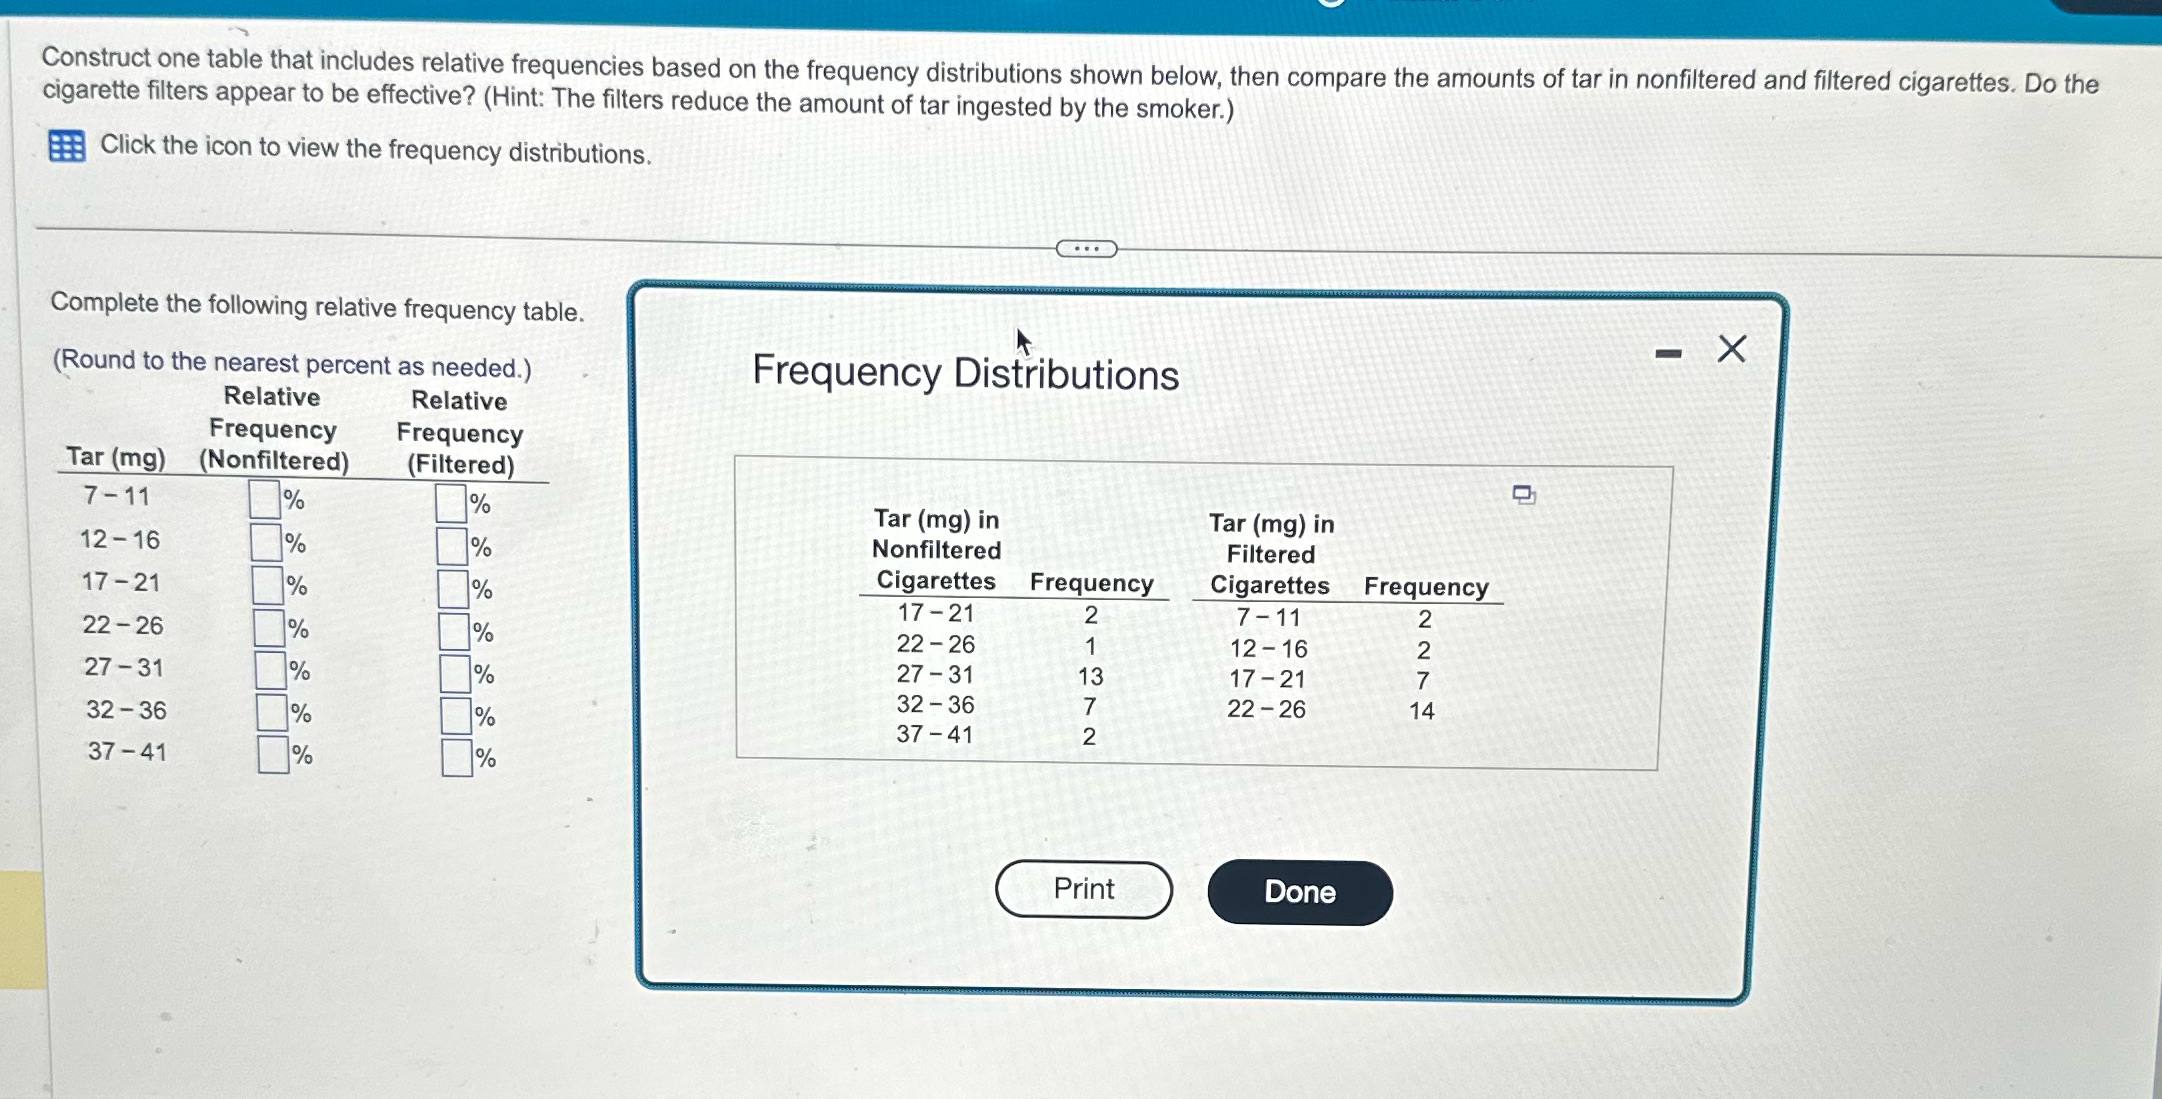
Question: - Construct one table that includes relative frequencies based on the frequency distributions shown below, then compare the amounts of tar in nonfiltered and filtered
Step by Step Solution
There are 3 Steps involved in it
1 Expert Approved Answer
Step: 1 Unlock

Question Has Been Solved by an Expert!
Get step-by-step solutions from verified subject matter experts
Step: 2 Unlock
Step: 3 Unlock