

Question: Construct one table that includes relative frequencies based on the frequency distributions shown below, then compare the amounts of tar in nonfiltered and filtered cigarettes.
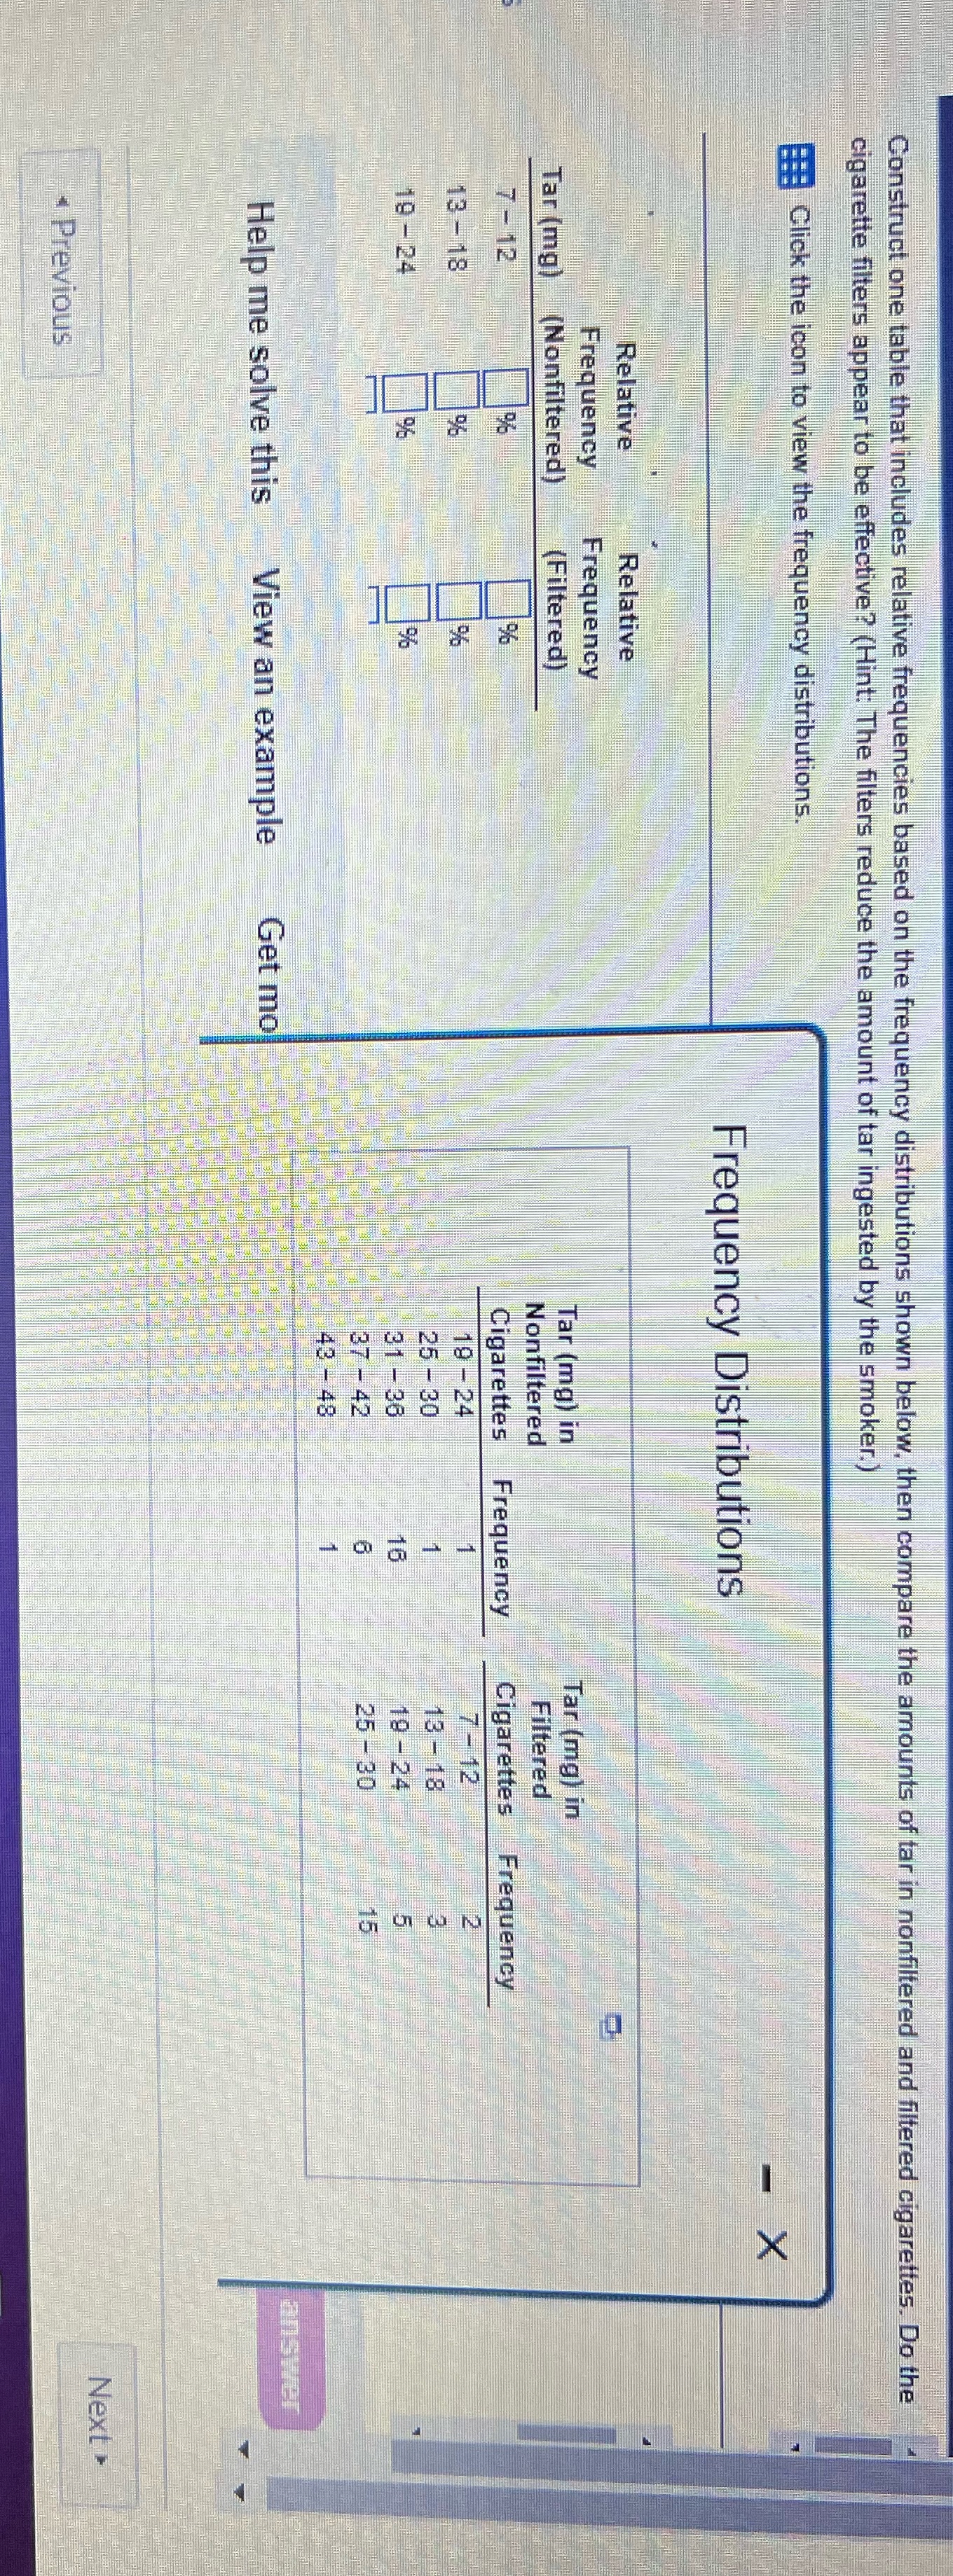
Construct one table that includes relative frequencies based on the frequency distributions shown below, then compare the amounts of tar in nonfiltered and filtered cigarettes. Do the cigarette filters appear to be effective? (Hint: The filters reduce the amount of tar ingested by the smoker.) Click the icon to view the frequency distributions. - X Frequency Distributions Relative Relative Frequency Frequency Tar (mg) (Nonfiltered) (Filtered) Tar (mg) in Tar (mg) in Nonfiltered Filtered 7 - 12 Cigarettes Frequency Cigarettes Frequency 13 - 18 19 - 24 7-12 25 - 30 13 - 18 19 -24 31 - 36 19 - 24 37 - 42 25 -30 43 -48 Help me solve this View an example Get mo answer Next " Previous
Step by Step Solution
There are 3 Steps involved in it

Get step-by-step solutions from verified subject matter experts