

Question: Construct the appropriate control chart for the observations listed below, using 3 sigma limits . a . ( 1 5 points ) Determine the upper
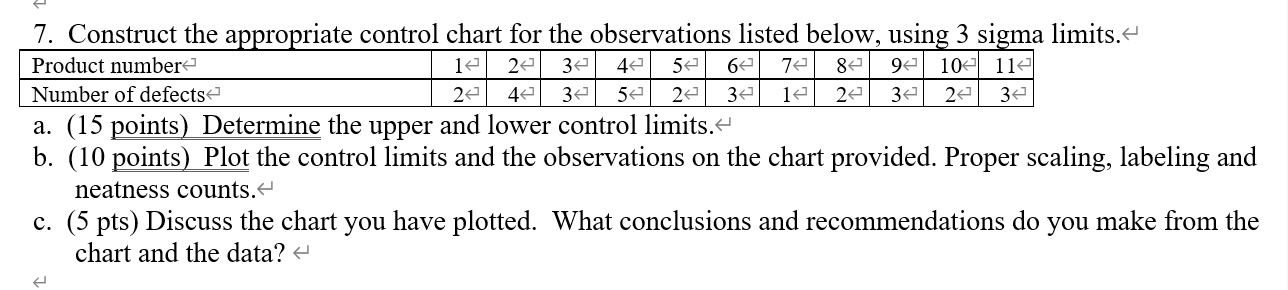
Construct the appropriate control chart for the observations listed below, using sigma limits
a points Determine the upper and lower control limits
b points Plot the control limits and the observations on the chart provided. Proper scaling, labeling and neatness counts.
c pts Discuss the chart you have plotted. What conclusions and recommendations do you make from the chart and the data?
Step by Step Solution
There are 3 Steps involved in it
1 Expert Approved Answer
Step: 1 Unlock

Question Has Been Solved by an Expert!
Get step-by-step solutions from verified subject matter experts
Step: 2 Unlock
Step: 3 Unlock