

Question: Construct the Cash Flow Statement for 2019A and 2020A. The Balance Sheet and the Income Statement are provided below: INCOME STATEMENT 2018A 2019A 2020A 19,613,484.30
Construct the Cash Flow Statement for 2019A and 2020A. The Balance Sheet and the Income Statement are provided below:
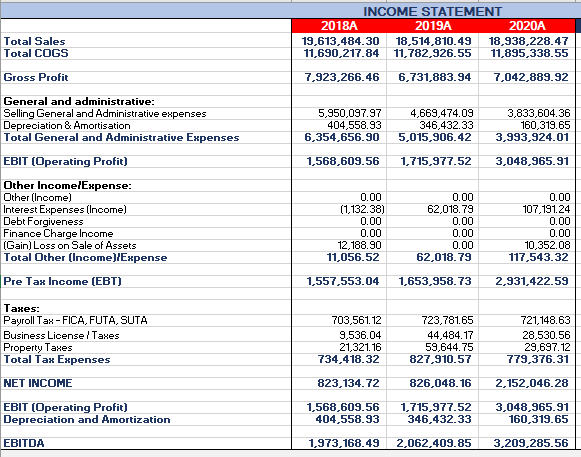
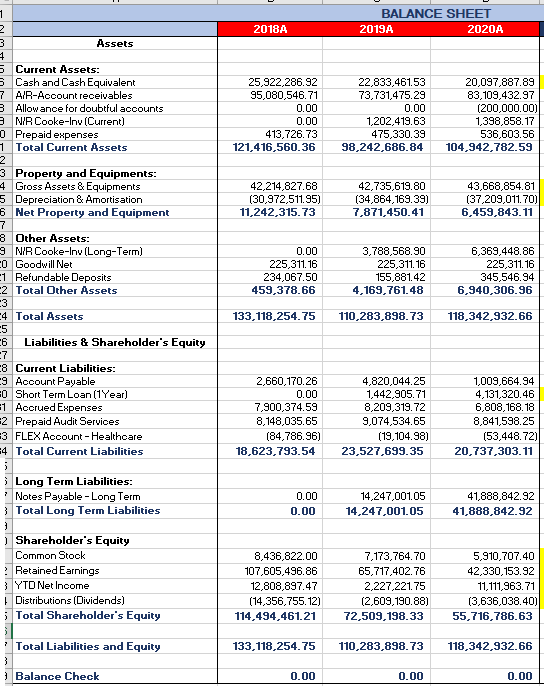
INCOME STATEMENT 2018A 2019A 2020A 19,613,484.30 18,514,810.49 18,938,228.47 11,690,217.84 11,782,926.55 11,895,338.55 Total Sales Total COGS Gross Profit 7,923,266.46 6,731,883.94 7,042,889.92 5,950,097.97 404,558.93 6,354,656.90 4,669,474.09 346,432.33 5,015,906.42 3,833,604.36 160,319.65 3,993,924.01 1,568,609.56 1,715,977.52 3,048,965.91 General and administrative: Selling General and Administrative expenses Depreciation & Amortisation Total General and Administrative Expenses EBIT (Operating Profit) Other IncomelExpense: Other (Income) Interest Expenses (Income) Debt Forgiveness Finance Charge Income (Gain) Loss on Sale of Assets Total Other (Income)/Expense Pre Tax Income (EBT) 0.00 (1.132.38) 0.00 0.00 12, 188.90 11,056.52 0.00 62,018.79 0.00 0.00 0.00 62,018.79 0.00 107,191.24 0.00 0.00 10,352.08 117,543.32 1,557,553.04 1,653,958.73 2,931,422.59 703,561.12 9,536.04 21,321.16 734,418.32 Taxes: Payroll Tax - FICA, FUTA, SUTA Business Licensel Taxes Property Taxes Total Tax Expenses NET INCOME EBIT (Operating Profit) Depreciation and Amortization 723,781.65 44,484.17 59,644.75 827,910.57 721, 148.63 28,530,56 29,697.12 779,376.31 823, 134.72 826,048.16 2,152,046.28 1,568,609.56 404,558.93 1,715,977.52 346,432.33 3,048,965.91 160,319.65 EBITDA 1,973, 168.49 2,062,409.85 3,209,285.56 BALANCE SHEET 2019A 2020A 2018A 25,922,286.92 95,080,546.71 0.00 0.00 413,726.73 121,416,560.36 22,833,461.53 73,731,475.29 0.00 1,202,419.63 475,330.39 98,242,686.84 20,097,887.89 83,109,432.97 (200,000.00) 1,398,858.17 536,603.56 104,942,782.59 42,214,827.68 (30,972,511.95) 11,242,315.73 42,735,619.80 (34,864,169.39) 7,871,450.41 43,668,854.81 (37,209,011.70) 6,459,843.11 0.00 225,311.16 234,067.50 459,378.66 3,788,568.90 225,311.16 155,881.42 4,169,761.48 6,369,448.86 225,311.16 345,546.94 6,940,306.96 1 2 3 Assets 4. 5 Current Assets: 5 Cash and Cash Equivalent 7 AIR-Account receivables 3 Allowance for doubtful accounts 3 N'R Cooke-Inv (Current) O Prepaid expenses 1 Total Current Assets 2 3 Property and Equipments: 4 Gross Assets & Equipments 5 Depreciation & Amortisation 6 Net Property and Equipment 7 8 Other Assets: 9 N'R Cooke-Inv (Long-Term) O Goodwill Net -1 Refundable Deposits 2 Total Other Assets -3 -4 Total Assets -5 -6 Liabilities & Shareholder's Equity -7 8 Current Liabilities: -9 Account Payable O Short Term Loan (1Year) =1 Acorued Expenses 2 Prepaid Audit Services 3 FLEX Account - Healthcare 4 Total Current Liabilities 3 3 Long Term Liabilities: Notes Payable - Long Term 3 Total Long Term Liabilities 1 Shareholder's Equity Common Stook ? Retained Earnings 3 YTD Net Income | Distributions (Dividends) i Total Shareholder's Equity 133, 118,254.75 110,283,898.73 118,342,932.66 2,660,170.26 0.00 7,900,374.59 8,148,035.65 (84,786.96) 18,623,793.54 4,820,044.25 1,442,905.71 8,209,319.72 9,074,534.65 (19,104.98) 23,527,699.35 1,009,664.94 4,131,320.46 6,808,168.18 8,841,598.25 (53,448.72) 20,737,303.11 0.00 0.00 14,247,001.05 14,247,001.05 41,888,842.92 41,888,842.92 8,436,822.00 107,605,496.86 12,808,897.47 (14,356,755.12) 114,494,461.21 7,173,764.70 65,717,402.76 2,227,221.75 (2,609, 190.88) 72,509,198.33 5,910,707.40 42,330,153.92 11,111,963.71 (3,636,038.40) 55,716,786.63 133, 118,254.75 110,283,898.73 118,342,932.66 ? Total Liabilities and Equity 3 Balance Check 0.00 0.00 0.00 INCOME STATEMENT 2018A 2019A 2020A 19,613,484.30 18,514,810.49 18,938,228.47 11,690,217.84 11,782,926.55 11,895,338.55 Total Sales Total COGS Gross Profit 7,923,266.46 6,731,883.94 7,042,889.92 5,950,097.97 404,558.93 6,354,656.90 4,669,474.09 346,432.33 5,015,906.42 3,833,604.36 160,319.65 3,993,924.01 1,568,609.56 1,715,977.52 3,048,965.91 General and administrative: Selling General and Administrative expenses Depreciation & Amortisation Total General and Administrative Expenses EBIT (Operating Profit) Other IncomelExpense: Other (Income) Interest Expenses (Income) Debt Forgiveness Finance Charge Income (Gain) Loss on Sale of Assets Total Other (Income)/Expense Pre Tax Income (EBT) 0.00 (1.132.38) 0.00 0.00 12, 188.90 11,056.52 0.00 62,018.79 0.00 0.00 0.00 62,018.79 0.00 107,191.24 0.00 0.00 10,352.08 117,543.32 1,557,553.04 1,653,958.73 2,931,422.59 703,561.12 9,536.04 21,321.16 734,418.32 Taxes: Payroll Tax - FICA, FUTA, SUTA Business Licensel Taxes Property Taxes Total Tax Expenses NET INCOME EBIT (Operating Profit) Depreciation and Amortization 723,781.65 44,484.17 59,644.75 827,910.57 721, 148.63 28,530,56 29,697.12 779,376.31 823, 134.72 826,048.16 2,152,046.28 1,568,609.56 404,558.93 1,715,977.52 346,432.33 3,048,965.91 160,319.65 EBITDA 1,973, 168.49 2,062,409.85 3,209,285.56 BALANCE SHEET 2019A 2020A 2018A 25,922,286.92 95,080,546.71 0.00 0.00 413,726.73 121,416,560.36 22,833,461.53 73,731,475.29 0.00 1,202,419.63 475,330.39 98,242,686.84 20,097,887.89 83,109,432.97 (200,000.00) 1,398,858.17 536,603.56 104,942,782.59 42,214,827.68 (30,972,511.95) 11,242,315.73 42,735,619.80 (34,864,169.39) 7,871,450.41 43,668,854.81 (37,209,011.70) 6,459,843.11 0.00 225,311.16 234,067.50 459,378.66 3,788,568.90 225,311.16 155,881.42 4,169,761.48 6,369,448.86 225,311.16 345,546.94 6,940,306.96 1 2 3 Assets 4. 5 Current Assets: 5 Cash and Cash Equivalent 7 AIR-Account receivables 3 Allowance for doubtful accounts 3 N'R Cooke-Inv (Current) O Prepaid expenses 1 Total Current Assets 2 3 Property and Equipments: 4 Gross Assets & Equipments 5 Depreciation & Amortisation 6 Net Property and Equipment 7 8 Other Assets: 9 N'R Cooke-Inv (Long-Term) O Goodwill Net -1 Refundable Deposits 2 Total Other Assets -3 -4 Total Assets -5 -6 Liabilities & Shareholder's Equity -7 8 Current Liabilities: -9 Account Payable O Short Term Loan (1Year) =1 Acorued Expenses 2 Prepaid Audit Services 3 FLEX Account - Healthcare 4 Total Current Liabilities 3 3 Long Term Liabilities: Notes Payable - Long Term 3 Total Long Term Liabilities 1 Shareholder's Equity Common Stook ? Retained Earnings 3 YTD Net Income | Distributions (Dividends) i Total Shareholder's Equity 133, 118,254.75 110,283,898.73 118,342,932.66 2,660,170.26 0.00 7,900,374.59 8,148,035.65 (84,786.96) 18,623,793.54 4,820,044.25 1,442,905.71 8,209,319.72 9,074,534.65 (19,104.98) 23,527,699.35 1,009,664.94 4,131,320.46 6,808,168.18 8,841,598.25 (53,448.72) 20,737,303.11 0.00 0.00 14,247,001.05 14,247,001.05 41,888,842.92 41,888,842.92 8,436,822.00 107,605,496.86 12,808,897.47 (14,356,755.12) 114,494,461.21 7,173,764.70 65,717,402.76 2,227,221.75 (2,609, 190.88) 72,509,198.33 5,910,707.40 42,330,153.92 11,111,963.71 (3,636,038.40) 55,716,786.63 133, 118,254.75 110,283,898.73 118,342,932.66 ? Total Liabilities and Equity 3 Balance Check 0.00 0.00 0.00
Step by Step Solution
There are 3 Steps involved in it

Get step-by-step solutions from verified subject matter experts