

Question: Construct the following graphs by hand - you cannot use any technology!! If the graphs are submitted with the use of any technology, no credit
Construct the following graphs by hand - you cannot use any technology!! If the graphs are submitted with the use of any technology, no credit will be given. Be sure to look at how each graph is created and label each graph including the axis.? Histogram on the Frequency? Stem and Leaf with the stem being 14, 15, 16,...26 and the leaves being the decimal point value? Ogive of the Cumulative Relative Frequency
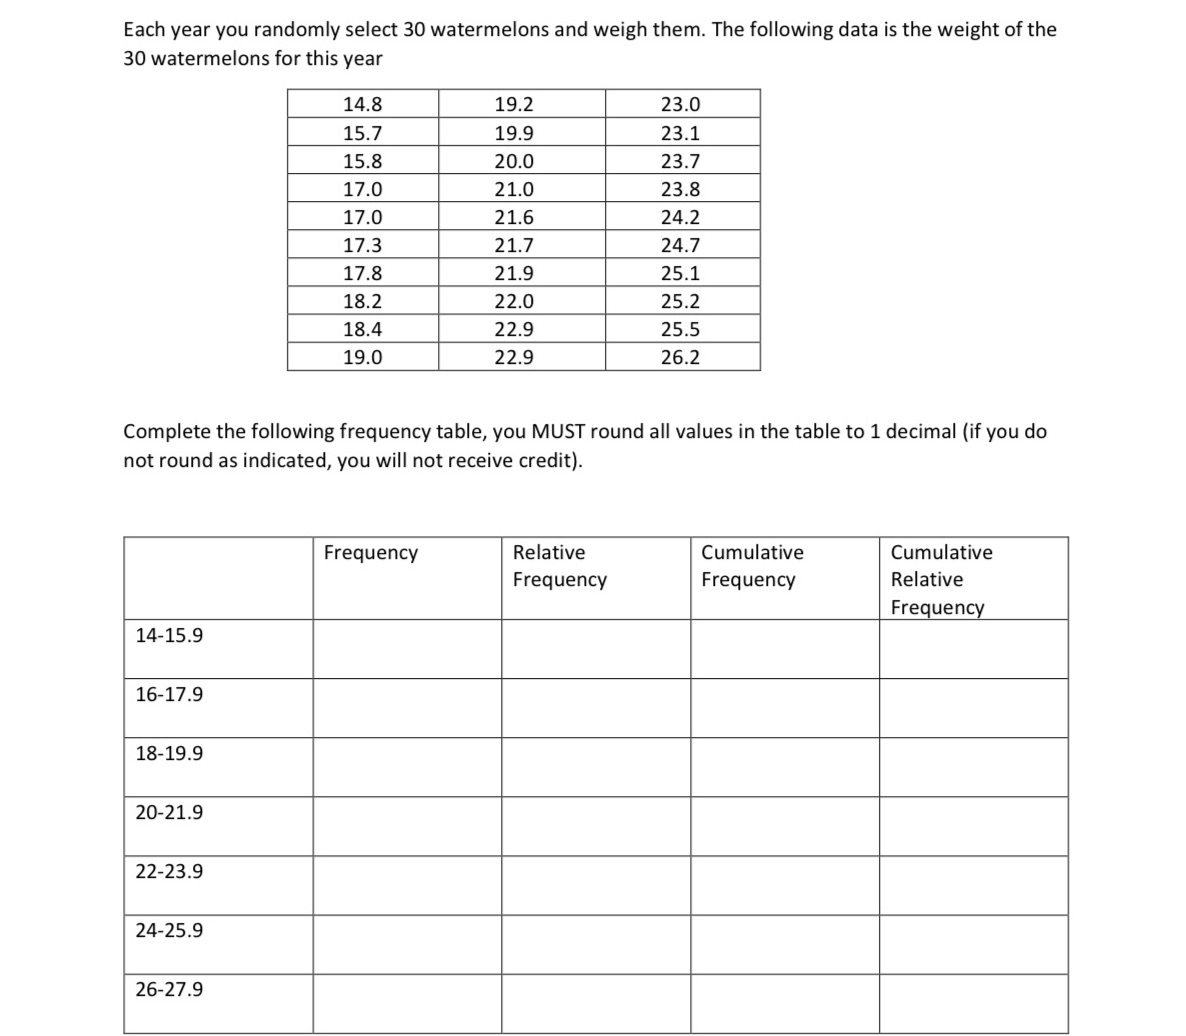
Each year you randomly select 30 watermelons and weigh them. The following data is the weight of the 30 watermelons for this year 14.8 19.2 23.0 15.7 19.9 23.1 15.8 20.0 23.7 17.0 21.0 23.8 17.0 21.6 24.2 17.3 21.7 24.7 17.8 21.9 25.1 18.2 22.0 25.2 18.4 22.9 25.5 19.0 22.9 26.2 Complete the following frequency table, you MUST round all values in the table to 1 decimal {if you do not round as indicated, you will not receive credit}. Frequency Relative Cumulative Cumulative Frequency Frequency Relative Frequency 24-25.9 26-27.9
Step by Step Solution
There are 3 Steps involved in it

Get step-by-step solutions from verified subject matter experts