

Question: Constructing a Straight-line Graph 2. Use the graph paper below to plot the ln(mass) vs. time using the data table above. Make sure you include
Constructing a Straight-line Graph
2. Use the graph paper below to plot the ln(mass) vs. time using the data table above. Make sure you include your line of best fit.
3. Determination of the Slope. You must show your Work! As well as the value, obtain the sign of the slope. Quote the slope to the appropriate number of significant figures.
Show Calculations:
4. According to your textbook, the slope should be given by: Slope = - (ln2) / (t1/2) = - (0.693) / (5.77 days) = 0.120 day-1
Calculate the % error of your slope and assess its accuracy as good (% error 5%).
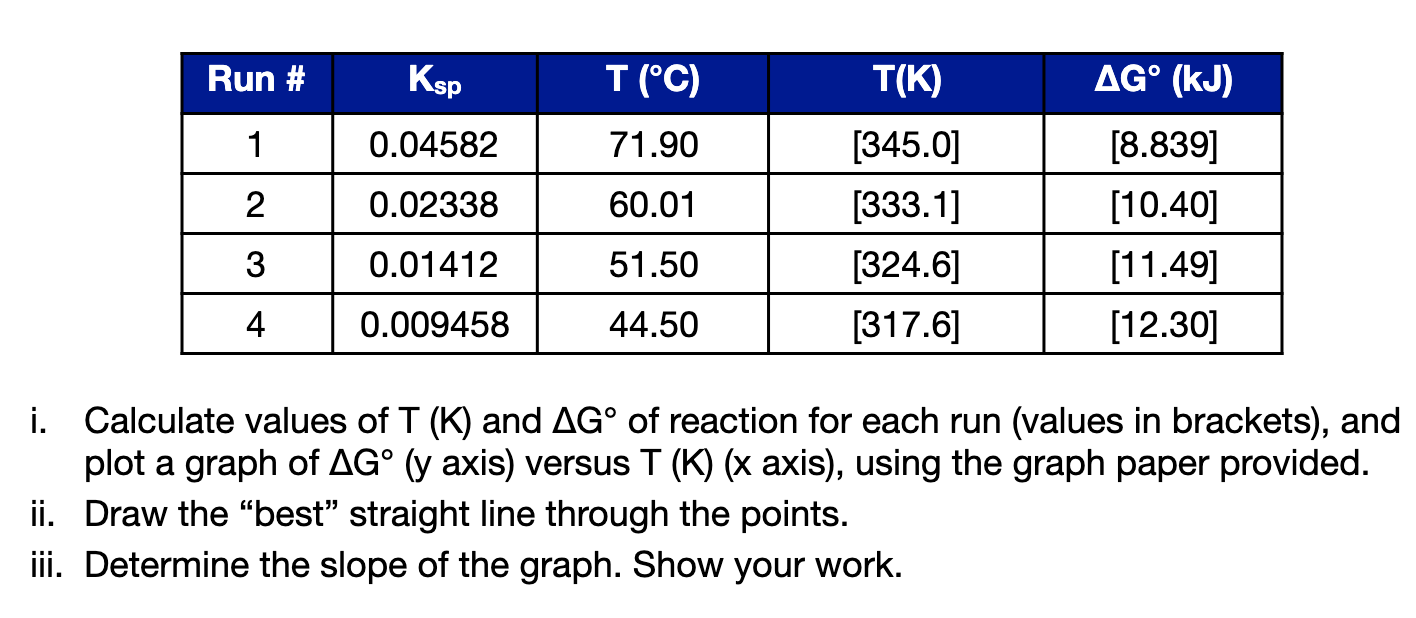
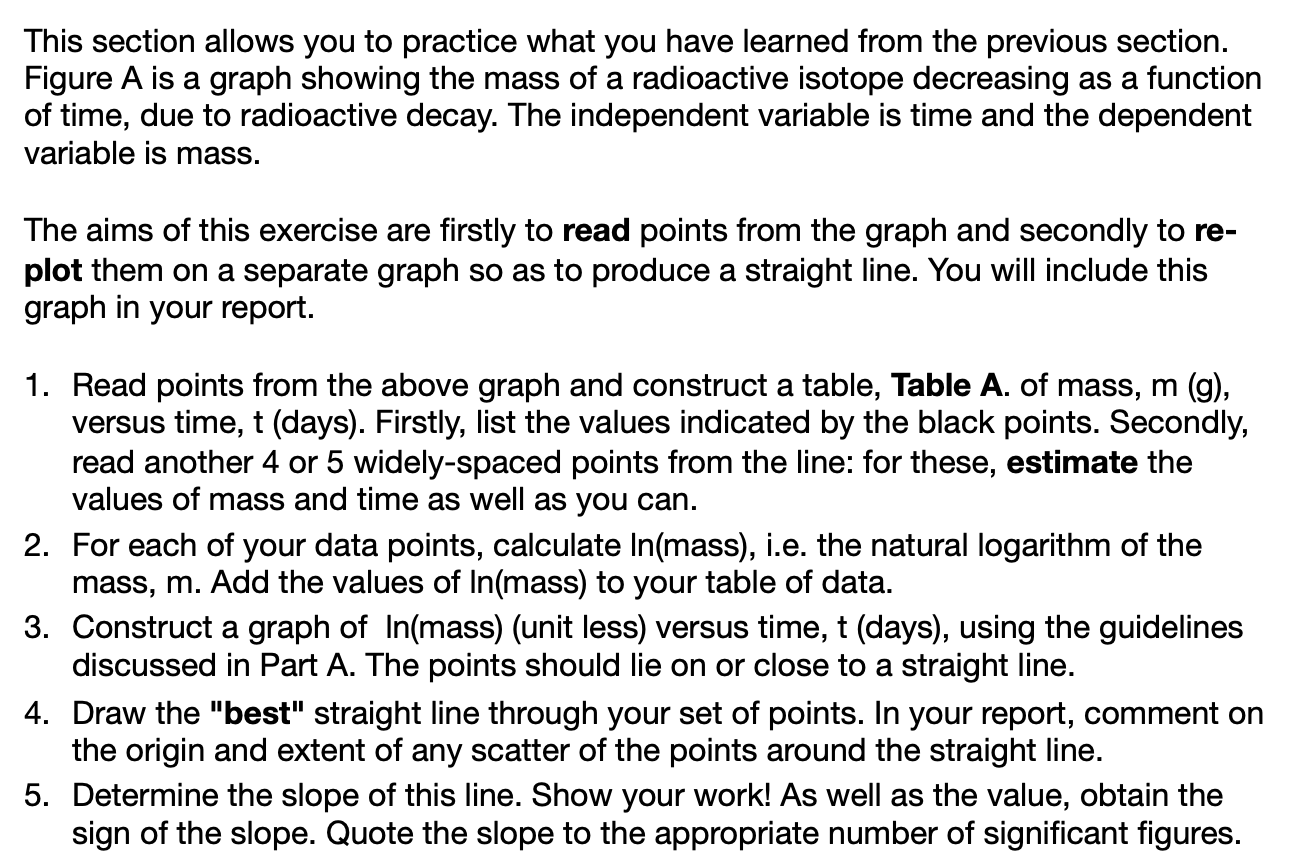
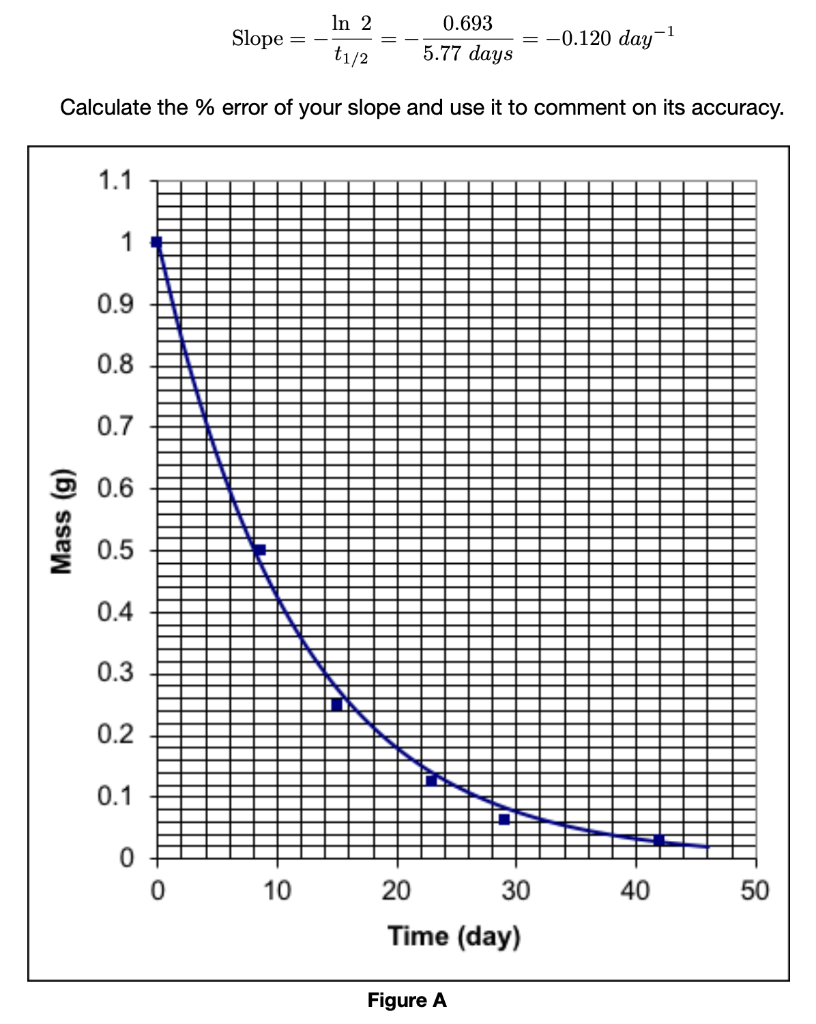
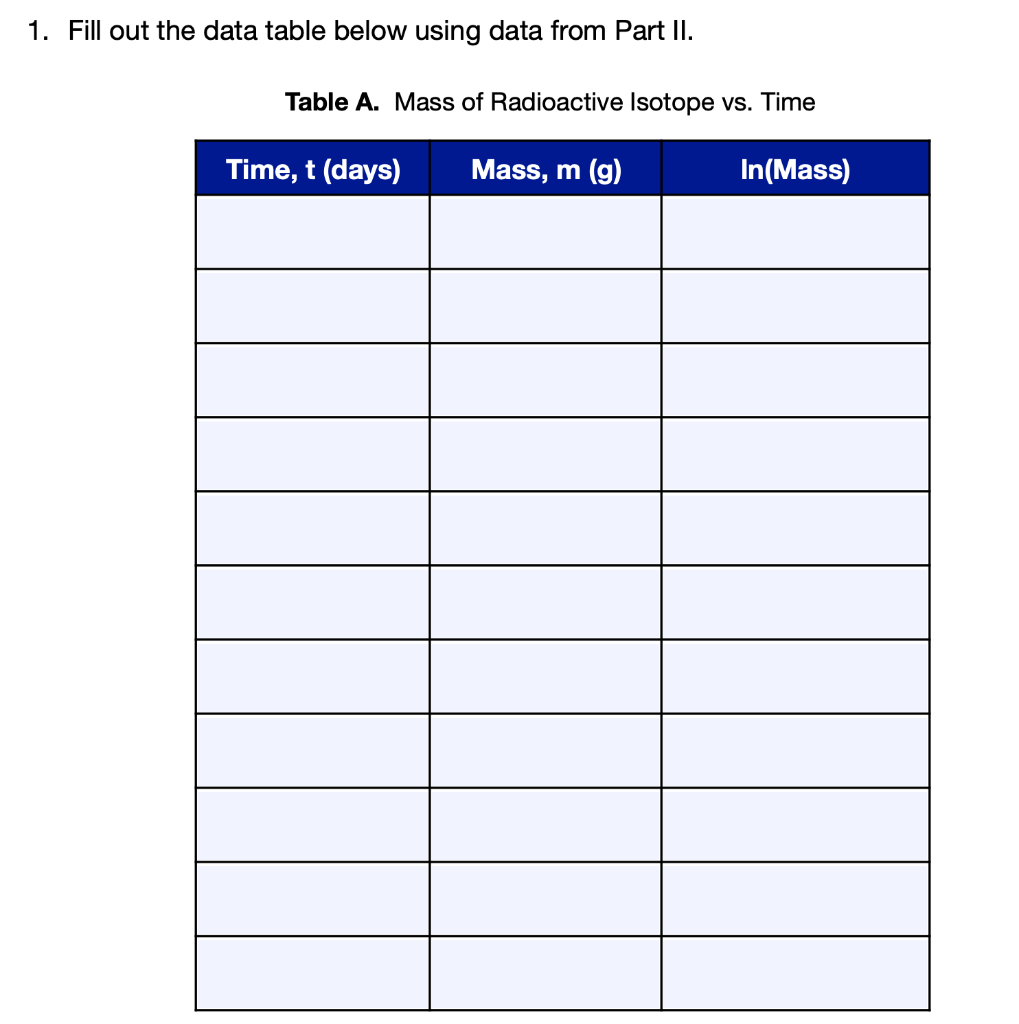
Run # sp T(C) AG (kJ) 1 0.04582 71.90 2 0.02338 60.01 T(K) [345.0] [333.1] [324.6] [317.6] [8.839] [10.40] [11.49] [12.30] 3 0.01412 51.50 4 0.009458 44.50 i. Calculate values of T (K) and AG of reaction for each run (values in brackets), and plot a graph of AG (y axis) versus T (K) (x axis), using the graph paper provided. ii. Draw the "best" straight line through the points. iii. Determine the slope of the graph. Show your work. This section allows you to practice what you have learned from the previous section. Figure A is a graph showing the mass of a radioactive isotope decreasing as a function of time, due to radioactive decay. The independent variable is time and the dependent variable is mass. The aims of this exercise are firstly to read points from the graph and secondly to re- plot them on a separate graph so as to produce a straight line. You will include this graph in your report. 1. Read points from the above graph and construct a table, Table A. of mass, m (g), versus time, t (days). Firstly, list the values indicated by the black points. Secondly, read another 4 or 5 widely-spaced points from the line: for these, estimate the values of mass and time as well as you can. 2. For each of your data points, calculate In(mass), i.e. the natural logarithm of the mass, m. Add the values of In(mass) to your table of data. 3. Construct a graph of In(mass) (unit less) versus time, t (days), using the guidelines discussed in Part A. The points should lie on or close to a straight line. 4. Draw the "best" straight line through your set of points. In your report, comment on the origin and extent of any scatter of the points around the straight line. 5. Determine the slope of this line. Show your work! As well as the value, obtain the sign of the slope. Quote the slope to the appropriate number of significant figures. In 2 Slope = 0.693 5.77 days -0.120 day-1 t1/2 Calculate the % error of your slope and use it to comment on its accuracy. 1.1 1 0.9 0.8 0.7 0.6 Mass (g) 0.5 0.4 0.3 0.2 0.1 0 0 10 20 30 40 50 Time (day) Figure A 1. Fill out the data table below using data from Part II. Table A. Mass of Radioactive Isotope vs. Time Time, t (days) Mass, m (g) In(Mass)
Step by Step Solution
There are 3 Steps involved in it

Get step-by-step solutions from verified subject matter experts