

Question: consume save Fill in the chart with the marginal propensity to consume (MPC), marginal propensity to save (MPS), simple spending multiplier, and the maximum
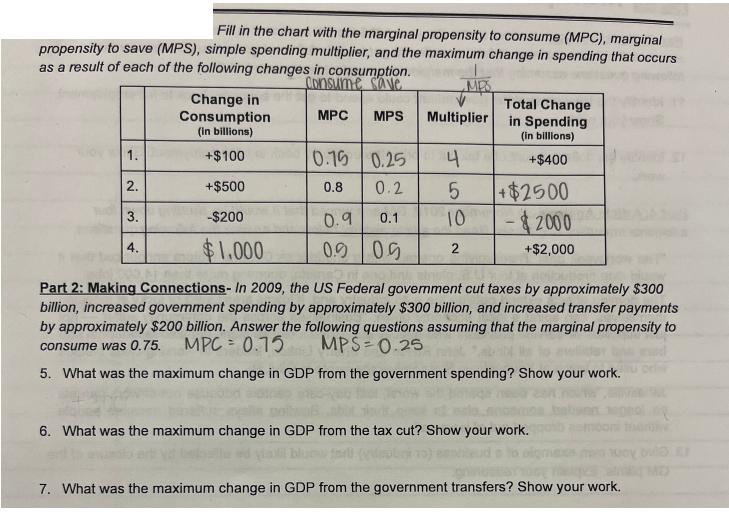

consume save Fill in the chart with the marginal propensity to consume (MPC), marginal propensity to save (MPS), simple spending multiplier, and the maximum change in spending that occurs as a result of each of the following changes in consumption. Change in Consumption (in billions) MPS Total Change MPC MPS Multiplier in Spending (in billions) 1. +$100 0.15 0.25 4 +$400 2. +$500 0.8 0.2 5 +$2500 3. -$200 0.9 0.1 10 -$2000 4. $1.000 0.9 0.9 2 +$2,000 Part 2: Making Connections- In 2009, the US Federal government cut taxes by approximately $300 billion, increased government spending by approximately $300 billion, and increased transfer payments by approximately $200 billion. Answer the following questions assuming that the marginal propensity to consume was 0.75. MPC 0.75 0.25 MPS 5. What was the maximum change in GDP from the government spending? Show your work. 6. What was the maximum change in GDP from the tax cut? Show your work. 7. What was the maximum change in GDP from the government transfers? Show your work. MES 8. If these numbers were accurate, what was the maximum change in GDP from the entire stimulus package? Show your work. 9. Assume instead that American consumers, fearing an economic collapse, increased their marginal propensity to save to 0.5. Would this increase, decrease, or not change the effectiveness of the stimulus package? Explain. 10. Assume the marginal propensity to save was 0.5 instead of 0.75. Calculate the maximum change in GDP from the entire stimulus package? Show your work.
Step by Step Solution
There are 3 Steps involved in it

Get step-by-step solutions from verified subject matter experts