

Question: contain analysis and discussion on 2- 3 ratios from each of the primary financial ratio categories (e.g., liquidity, profitability, operating efficiency, and capital structure). A
contain analysis and discussion on 2- 3 ratios from each of the primary financial ratio categories (e.g., liquidity, profitability, operating efficiency, and capital structure). A five-year trend analysis - including the most recent year of available information/data - is expected for each ratio selected. Interpret the ratios, the financial and market trends and provide your perspectives on the strengths and weaknesses of the organization.
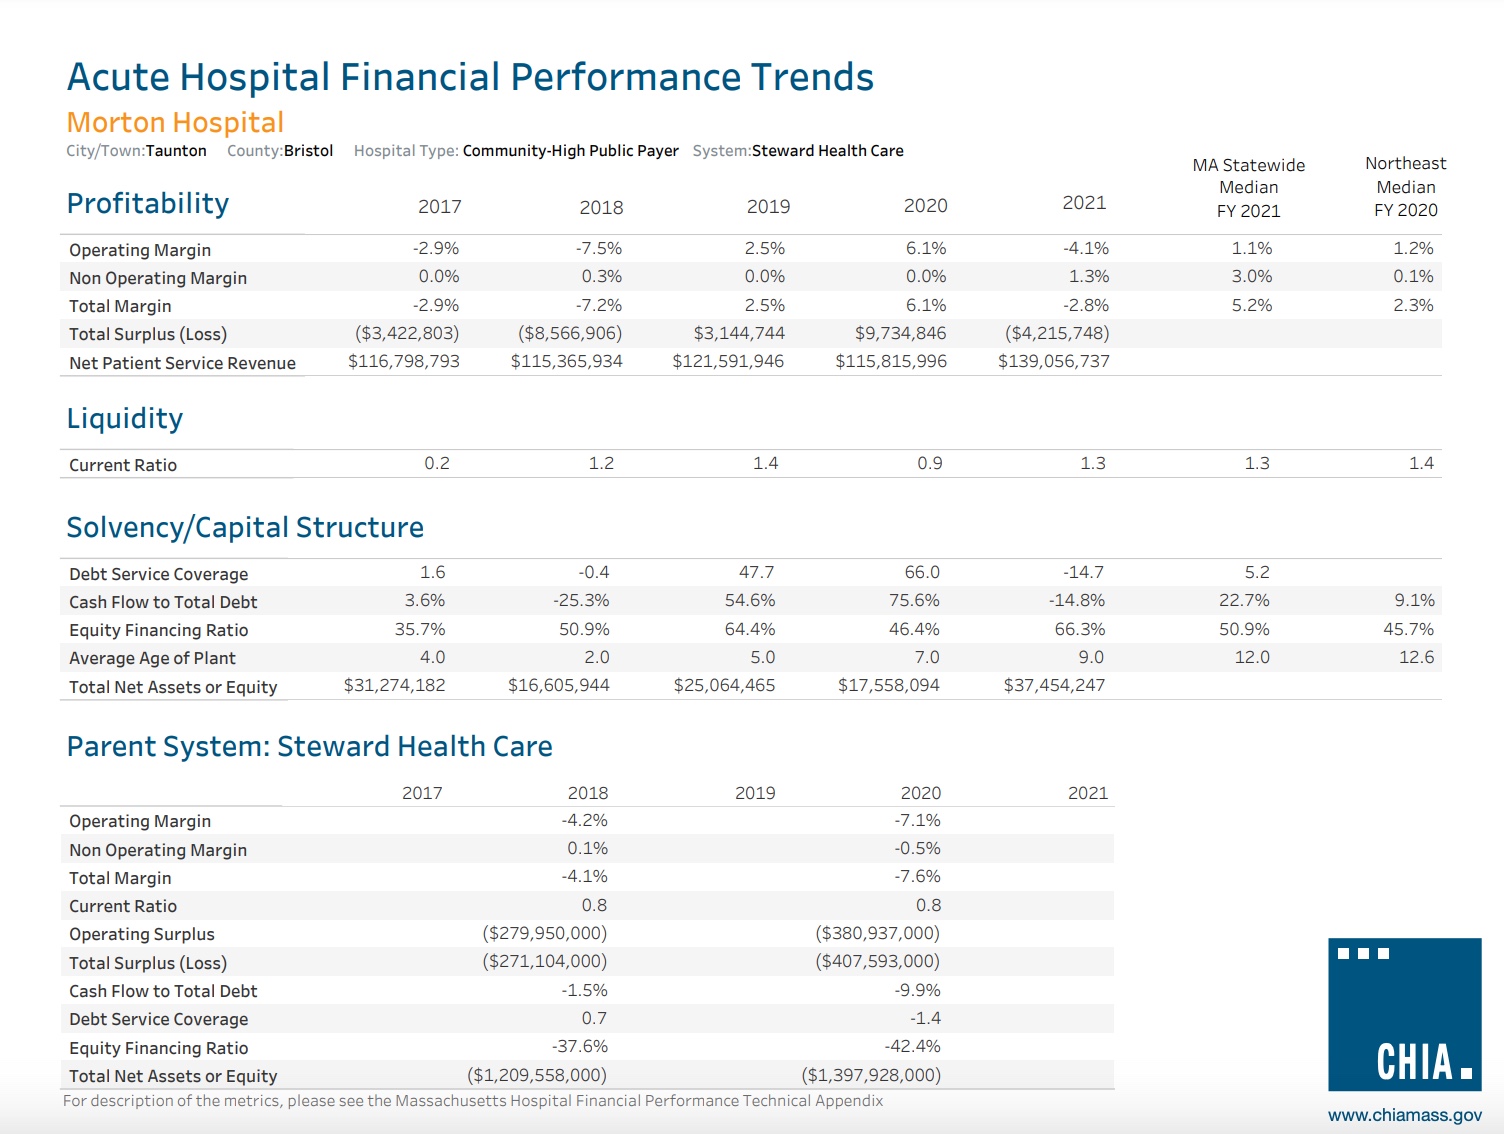
Acute Hospital Financial Performance Trends Morton Hospital City/Town:Taunton County: Bristol Hospital Type: Community-High Public Payer System: Steward Health Care Profitability 2017 2018 2019 2020 2021 FY 2021 MA Statewide Median Northeast Median FY 2020 Operating Margin -2.9% -7.5% 2.5% 6.1% -4.1% 1.1% 1.2% Non Operating Margin Total Margin 0.0% 0.3% 0.0% 0.0% 1.3% 3.0% 0.1% -2.9% -7.2% 2.5% 6.1% -2.8% 5.2% 2.3% Total Surplus (Loss) ($3,422,803) ($8,566,906) $3,144,744 $9,734,846 ($4,215,748) Net Patient Service Revenue $116,798,793 $115,365,934 $121,591,946 $115,815,996 $139,056,737 Liquidity Current Ratio 0.2 1.2 1.4 0.9 1.3 1.3 1.4 Solvency/Capital Structure Debt Service Coverage 1.6 Cash Flow to Total Debt 3.6% -0.4 -25.3% 47.7 54.6% Equity Financing Ratio 35.7% Average Age of Plant 4.0 50.9% 2.0 64.4% 5.0 66.0 75.6% 46.4% 7.0 -14.7 -14.8% 5.2 22.7% 66.3% 50.9% 9.0 12.0 Total Net Assets or Equity $31,274,182 $16,605,944 $25,064,465 $17,558,094 $37,454,247 Parent System: Steward Health Care Operating Margin Non Operating Margin Total Margin Current Ratio Operating Surplus Total Surplus (Loss) Cash Flow to Total Debt Debt Service Coverage Equity Financing Ratio Total Net Assets or Equity 2017 2018 2019 2020 2021 -4.2% -7.1% 0.1% -0.5% -4.1% -7.6% 0.8 0.8 ($279,950,000) ($380,937,000) ($271,104,000) -1.5% 0.7 -37.6% ($1,209,558,000) ($407,593,000) -9.9% -1.4 -42.4% ($1,397,928,000) For description of the metrics, please see the Massachusetts Hospital Financial Performance Technical Appendix 9.1% 45.7% 12.6 CHIA. www.chiamass.gov
Step by Step Solution
There are 3 Steps involved in it
Liquidity Ratio Current Ratio Interpretation The current ratio measures a hospitals ability to meet its shortterm obligations with its shortterm asset... View full answer

Get step-by-step solutions from verified subject matter experts