

Question: Context for Questions/Table: Questions/Table Below : Extras: Tortuga Tarpon Classic The company has two separate research teams working on the project and they develop two
Context for Questions/Table:
Questions/Table Below :
Extras:
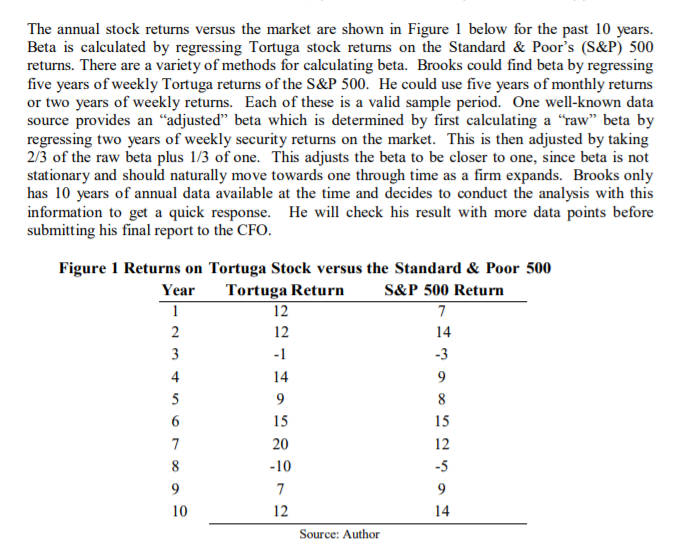
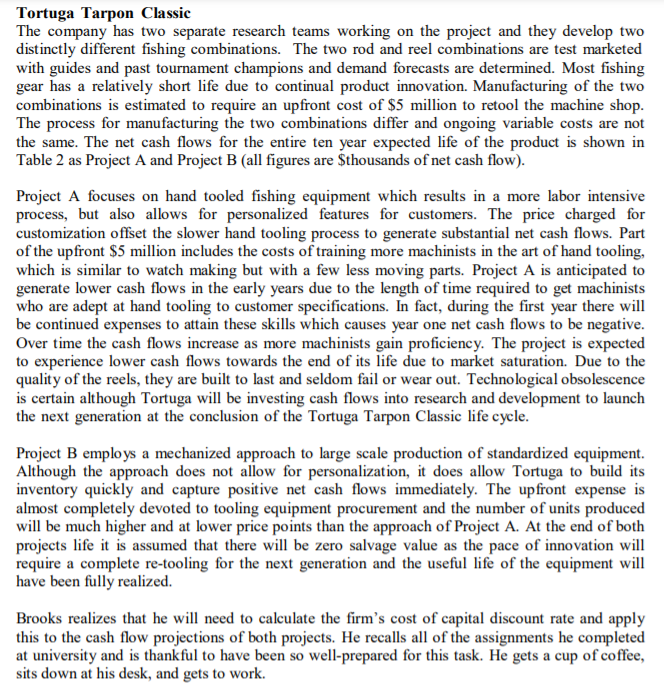
Tortuga Tarpon Classic The company has two separate research teams working on the project and they develop two distinctly different fishing combinations. The two rod and reel combinations are test marketed with guides and past tournament champions and demand forecasts are determined. Most fishing gear has a relatively short life due to continual product innovation. Manufacturing of the two combinations is estimated to require an upfront cost of $5 million to retool the machine shop. The process for manufacturing the two combinations differ and ongoing variable costs are not the same. The net cash flows for the entire ten year expected life of the product is shown in Table 2 as Project A and Project B (all figures are $thousands of net cash flow). Project A focuses on hand tooled fishing equipment which results in a more labor intensive process, but also allows for personalized features for customers. The price charged for customization offset the slower hand tooling process to generate substantial net cash flows. Part of the upfront $5 million includes the costs of training more machinists in the art of hand tooling, which is similar to watch making but with a few less moving parts. Project A is anticipated to generate lower cash flows in the early years due to the length of time required to get machinists who are adept at hand tooling to customer specifications. In fact, during the first year there will be continued expenses to attain these skills which causes year one net cash flows to be negative. Over time the cash flows increase as more machinists gain proficiency. The project is expected to experience lower cash flows towards the end of its life due to market saturation. Due to the quality of the reels, they are built to last and seldom fail or wear out. Technological obsolescence is certain although Tortuga will be investing cash flows into research and development to launch the next generation at the conclusion of the Tortuga Tarpon Classic life cycle. Project B employs a mechanized approach to large scale production of standardized equipment. Although the approach does not allow for personalization, it does allow Tortuga to build its inventory quickly and capture positive net cash flows immediately. The upfront expense is almost completely devoted to tooling equipment procurement and the number of units produced will be much higher and at lower price points than the approach of Project A. At the end of both projects life it is assumed that there will be zero salvage value as the pace of innovation will require a complete re-tooling for the next generation and the useful life of the equipment will have been fully realized. Brooks realizes that he will need to calculate the firm's cost of capital discount rate and apply this to the cash flow projections of both projects. He recalls all of the assignments he completed at university and is thankful to have been so well-prepared for this task. He gets a cup of coffee, sits down at his desk, and gets to work. Figure 2 Project Net Cash Flows for Tortuga Fishing Equipment ($thousands) Year Project A Project B 1 200 830 2 600 830 3 800 830 4 900 830 5 1500 830 6 1000 830 7 1000 830 8 900 830 9 900 830 10 800 830 Source: Author Since Brooks is new to his role, you have been asked to review his work and assess the financial viability of the projects. Given the importance of this decision you are helping to make sure the firm makes the right choice. Specific Questions 1. Using the Capital Asset Pricing Model, what is the required rate of return on equity, re (cost of equity) for Tortuga? (Hint: Use the slope function in excel to find beta.) 2. Analyzing the company's bond, what is the yield to maturity on the bond issue, ra (cost of debt)? 3. Using the market weight of equity (i.e., based on the market value of equity), the original issue amount of debt, and the outstanding portion of the revolving line of credit, what are the weights of equity and debt in the capital structure (w & wa)? 4. Using the information provided, what is the firm's weighted average cost of capital (WACC)? 5. What are the net present value (NPV) and internal rate of return (IRR) for Projects A & B? What do you suggest to Tortuga? The annual stock returns versus the market are shown in Figure 1 below for the past 10 years. Beta is calculated by regressing Tortuga stock returns on the Standard & Poor's (S&P) 500 returns. There are a variety of methods for calculating beta. Brooks could find beta by regressing five years of weekly Tortuga returns of the S&P 500. He could use five years of monthly returns or two years of weekly returns. Each of these is a valid sample period. One well-known data source provides an "adjusted beta which is determined by first calculating a "raw" beta by regressing two years of weekly security returns on the market. This is then adjusted by taking 2/3 of the raw beta plus 1/3 of one. This adjusts the beta to be closer to one, since beta is not stationary and should naturally move towards one through time as a firm expands. Brooks only has 10 years of annual data available at the time and decides to conduct the analysis with this information to get a quick response. He will check his result with more data points before submitting his final report to the CFO. Figure 1 Returns on Tortuga Stock versus the Standard & Poor 500 Year Tortuga Return S&P 500 Return 1 12 7 2 12 14 3 -1 -3 4 14 9 5 9 8 6 15 15 7 12 8 -10 -5 9 7 9 10 12 14 Source: Author 20 Tortuga Tarpon Classic The company has two separate research teams working on the project and they develop two distinctly different fishing combinations. The two rod and reel combinations are test marketed with guides and past tournament champions and demand forecasts are determined. Most fishing gear has a relatively short life due to continual product innovation. Manufacturing of the two combinations is estimated to require an upfront cost of $5 million to retool the machine shop. The process for manufacturing the two combinations differ and ongoing variable costs are not the same. The net cash flows for the entire ten year expected life of the product is shown in Table 2 as Project A and Project B (all figures are $thousands of net cash flow). Project A focuses on hand tooled fishing equipment which results in a more labor intensive process, but also allows for personalized features for customers. The price charged for customization offset the slower hand tooling process to generate substantial net cash flows. Part of the upfront $5 million includes the costs of training more machinists in the art of hand tooling, which is similar to watch making but with a few less moving parts. Project A is anticipated to generate lower cash flows in the early years due to the length of time required to get machinists who are adept at hand tooling to customer specifications. In fact, during the first year there will be continued expenses to attain these skills which causes year one net cash flows to be negative. Over time the cash flows increase as more machinists gain proficiency. The project is expected to experience lower cash flows towards the end of its life due to market saturation. Due to the quality of the reels, they are built to last and seldom fail or wear out. Technological obsolescence is certain although Tortuga will be investing cash flows into research and development to launch the next generation at the conclusion of the Tortuga Tarpon Classic life cycle. Project B employs a mechanized approach to large scale production of standardized equipment. Although the approach does not allow for personalization, it does allow Tortuga to build its inventory quickly and capture positive net cash flows immediately. The upfront expense is almost completely devoted to tooling equipment procurement and the number of units produced will be much higher and at lower price points than the approach of Project A. At the end of both projects life it is assumed that there will be zero salvage value as the pace of innovation will require a complete re-tooling for the next generation and the useful life of the equipment will have been fully realized. Brooks realizes that he will need to calculate the firm's cost of capital discount rate and apply this to the cash flow projections of both projects. He recalls all of the assignments he completed at university and is thankful to have been so well-prepared for this task. He gets a cup of coffee, sits down at his desk, and gets to work. Figure 2 Project Net Cash Flows for Tortuga Fishing Equipment ($thousands) Year Project A Project B 1 200 830 2 600 830 3 800 830 4 900 830 5 1500 830 6 1000 830 7 1000 830 8 900 830 9 900 830 10 800 830 Source: Author Since Brooks is new to his role, you have been asked to review his work and assess the financial viability of the projects. Given the importance of this decision you are helping to make sure the firm makes the right choice. Specific Questions 1. Using the Capital Asset Pricing Model, what is the required rate of return on equity, re (cost of equity) for Tortuga? (Hint: Use the slope function in excel to find beta.) 2. Analyzing the company's bond, what is the yield to maturity on the bond issue, ra (cost of debt)? 3. Using the market weight of equity (i.e., based on the market value of equity), the original issue amount of debt, and the outstanding portion of the revolving line of credit, what are the weights of equity and debt in the capital structure (w & wa)? 4. Using the information provided, what is the firm's weighted average cost of capital (WACC)? 5. What are the net present value (NPV) and internal rate of return (IRR) for Projects A & B? What do you suggest to Tortuga? The annual stock returns versus the market are shown in Figure 1 below for the past 10 years. Beta is calculated by regressing Tortuga stock returns on the Standard & Poor's (S&P) 500 returns. There are a variety of methods for calculating beta. Brooks could find beta by regressing five years of weekly Tortuga returns of the S&P 500. He could use five years of monthly returns or two years of weekly returns. Each of these is a valid sample period. One well-known data source provides an "adjusted beta which is determined by first calculating a "raw" beta by regressing two years of weekly security returns on the market. This is then adjusted by taking 2/3 of the raw beta plus 1/3 of one. This adjusts the beta to be closer to one, since beta is not stationary and should naturally move towards one through time as a firm expands. Brooks only has 10 years of annual data available at the time and decides to conduct the analysis with this information to get a quick response. He will check his result with more data points before submitting his final report to the CFO. Figure 1 Returns on Tortuga Stock versus the Standard & Poor 500 Year Tortuga Return S&P 500 Return 1 12 7 2 12 14 3 -1 -3 4 14 9 5 9 8 6 15 15 7 12 8 -10 -5 9 7 9 10 12 14 Source: Author 20
Step by Step Solution
There are 3 Steps involved in it

Get step-by-step solutions from verified subject matter experts