

Question: CONTEXT: Scatterplot. Delete any extra space above and below the graph. Scores vs Hours 100 Scores 0.0 0.5 1.0 1.5 2.0 2.5 3.0 Hours Correlation
CONTEXT:
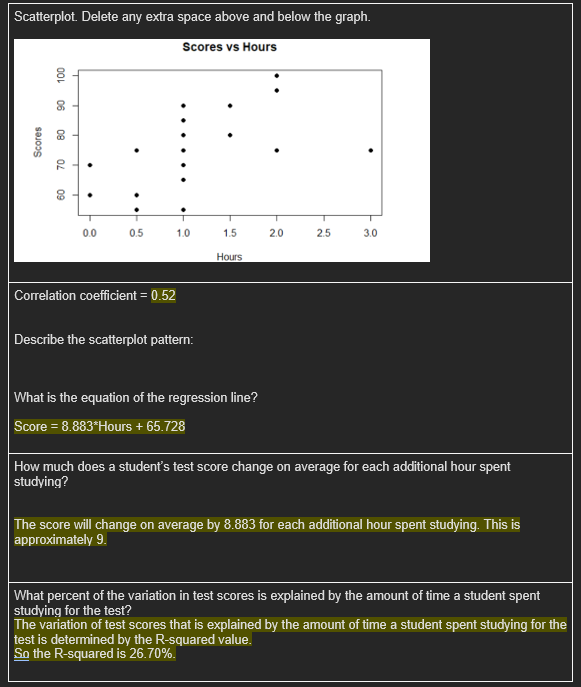
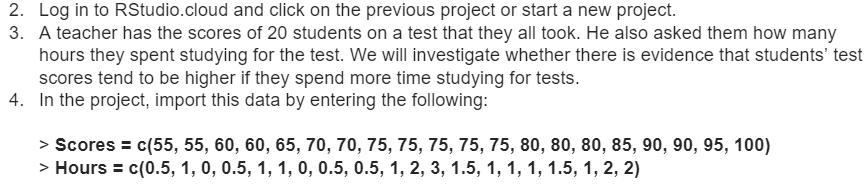
Scatterplot. Delete any extra space above and below the graph. Scores vs Hours 100 Scores 0.0 0.5 1.0 1.5 2.0 2.5 3.0 Hours Correlation coefficient = 0.52 Describe the scatterplot pattern: What is the equation of the regression line? Score = 8.883*Hours + 65.728 How much does a student's test score change on average for each additional hour spent studying? The score will change on average by 8.883 for each additional hour spent studying. This is approximately 9. What percent of the variation in test scores is explained by the amount of time a student spent studying for the test? The variation of test scores that is explained by the amount of time a student spent studying for the test is determined by the R-squared value. Sin the R-squared is 26.70%.2. Log in to RStudio.cIoud and click on the previous project or start a new project. 3. A teacher has the scores of 20 students on a test that they all took. He also asked them how many hours they spent studying for the test. We will investigate whether there is evidence that students' test scores tend to be higher if they spend more time studying for tests. 4. In the project, import this data by entering the following: > Scores = c(55, 55, 51}, 50, 55,70,717, 75, 75,75, 75, 75, so, so, so, 35, 90, 90, 95,100} > Hours = c(0.5, 1, o, 0.5, 1, 1, o, 0.5, 0.5, 1, 2, 3, 1.5, 1, 1, 1, 1.5, 1, 2, 2)
Step by Step Solution
There are 3 Steps involved in it

Get step-by-step solutions from verified subject matter experts