

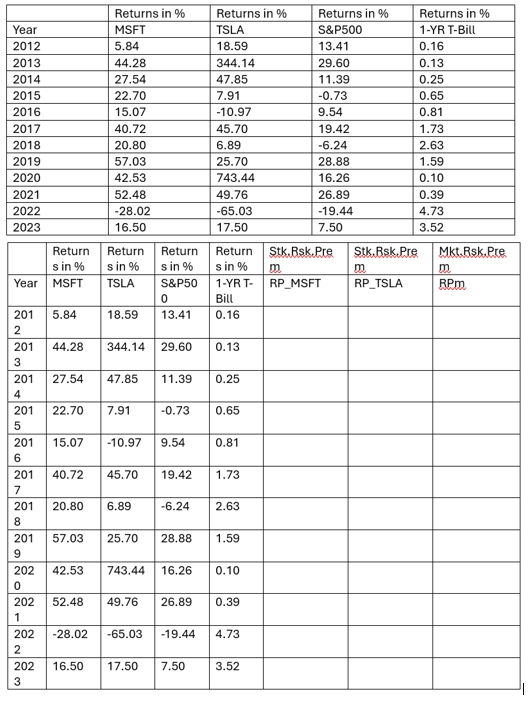
Question: Continuing with the previous data, see attached, regarding Market Index ( S&P 5 0 0 ) , and 1 - YR US T - bill
Continuing with the previous data, see attached, regarding Market Index S&P and YR US Tbill rates Riskfree rate proxy we have the following tabular data, see attached,
Calculate the following refer :
Market Risk Premium RPm
Risk Premium for MSFT
Risk Premium for TSLA
What are the average values for each of the above?
tableReturns in Returns in Returns in Returns in YearMSFTTSLA,S&P YR TBillRegress Stock.Risk.Premium as Dependent Y variable again Market Risk Premium for both MSFT and TSLA Refer Eqn Use Excel Data Manu Data Analysis Regression Status your Inputs Y and X
What findings do your two regressions show?
What is the respective systematic risk betas for MSFT and for TSLA refer C
Conceptualize your analysis by summarizing your findings.
Step by Step Solution
There are 3 Steps involved in it
1 Expert Approved Answer
Step: 1 Unlock

Question Has Been Solved by an Expert!
Get step-by-step solutions from verified subject matter experts
Step: 2 Unlock
Step: 3 Unlock