

Question: CONTROL CHART Step 1: Process Evaluation Evaluate a process improvement using 1 of the following: Use the lean concept to find ways to eliminate waste
CONTROL CHART
Step 1: Process Evaluation
Evaluate a process improvement using 1 of the following:
Use the lean concept to find ways to eliminate waste and improve the process.
Use SPC or Six Sigma to reduce defects or variances in the process.
**Process to be evaluated is PLANNING OPTIMIZATION in AIRCRAFT PRODUCTION*
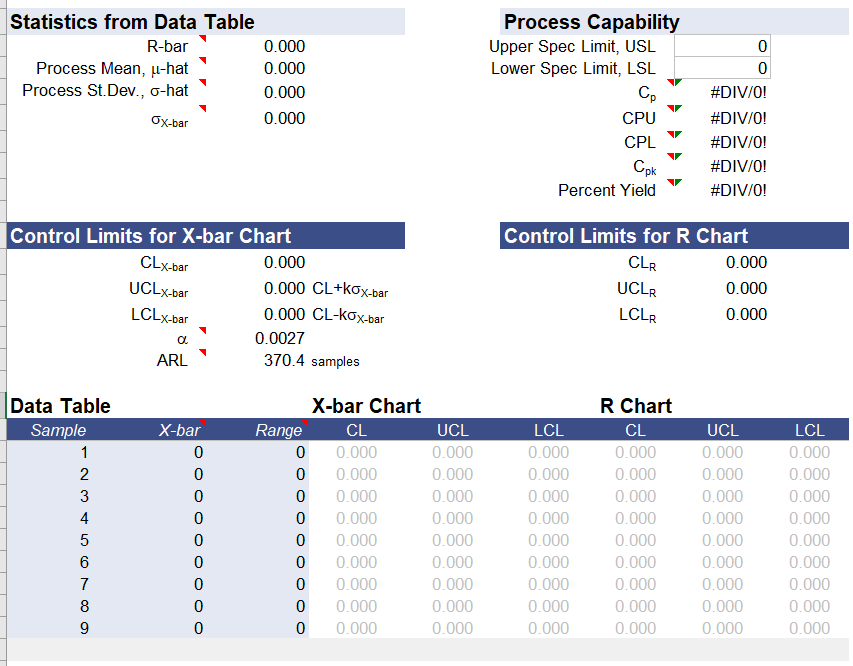
Step 2: Evaluation of Control Chart and Process Metrics Complete the following in Excel:
Calculate the defined process metrics including variation and process capability.
Develop and display a control chart for the process.
Evaluate the control chart and process metrics using Statistical Process Control (SPC) methods. Determine whether the process could benefit from the use of Six Sigma, Lean, or other tools. (Include all calculations and charts.)
9 Aircraft total in the evaluation, CURRENT STATE is 88.5 span hours for the specified job, FUTURE STATE is 33.4 span hours for the specified job & the IDEAL STATE is 30 span hours for the specified job
Provide the X-BAR Date, UCL, LCL and UPPER SPEC LIMIT and LOWER SPEC LIMIT and RANGE
Step by Step Solution
There are 3 Steps involved in it

Get step-by-step solutions from verified subject matter experts