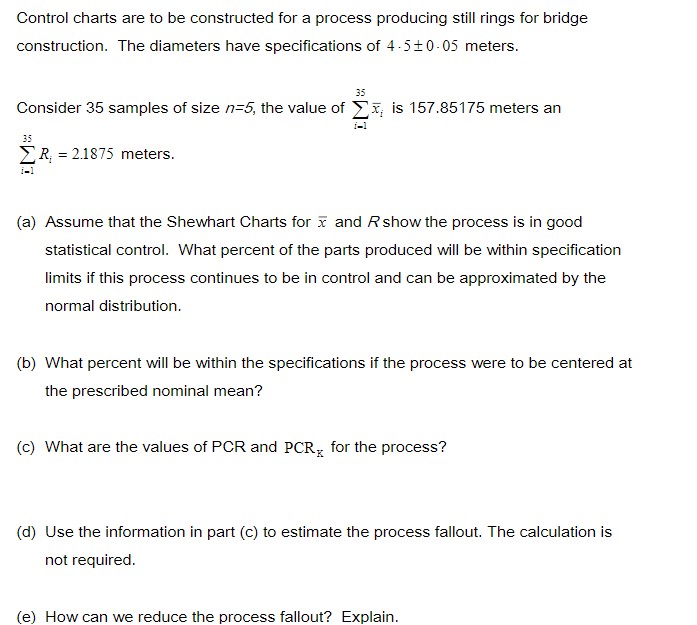
Question: Control charts are to be constructed for a process producing still rings for bridge construction. The diameters have specifications of 4.510 -05 meters. Consider 35

Control charts are to be constructed for a
Control charts are to be constructed for a process producing still rings for bridge construction. The diameters have specifications of 4.510 -05 meters. Consider 35 samples of size /=5, the value of > x, is 157.85175 meters an R; = 2.1875 meters. (a) Assume that the Shewhart Charts for x and R show the process is in good statistical control. What percent of the parts produced will be within specification limits if this process continues to be in control and can be approximated by the normal distribution. (b) What percent will be within the specifications if the process were to be centered at the prescribed nominal mean? (c) What are the values of PCR and PCR, for the process? (d) Use the information in part (c) to estimate the process fallout. The calculation is not required. (e) How can we reduce the process fallout? Explain

Step by Step Solution

There are 3 Steps involved in it

1 Expert Approved Answer
Step: 1 Unlock blur-text-image
Question Has Been Solved by an Expert!

Get step-by-step solutions from verified subject matter experts

Step: 2 Unlock
Step: 3 Unlock

Students Have Also Explored These Related Mathematics Questions!