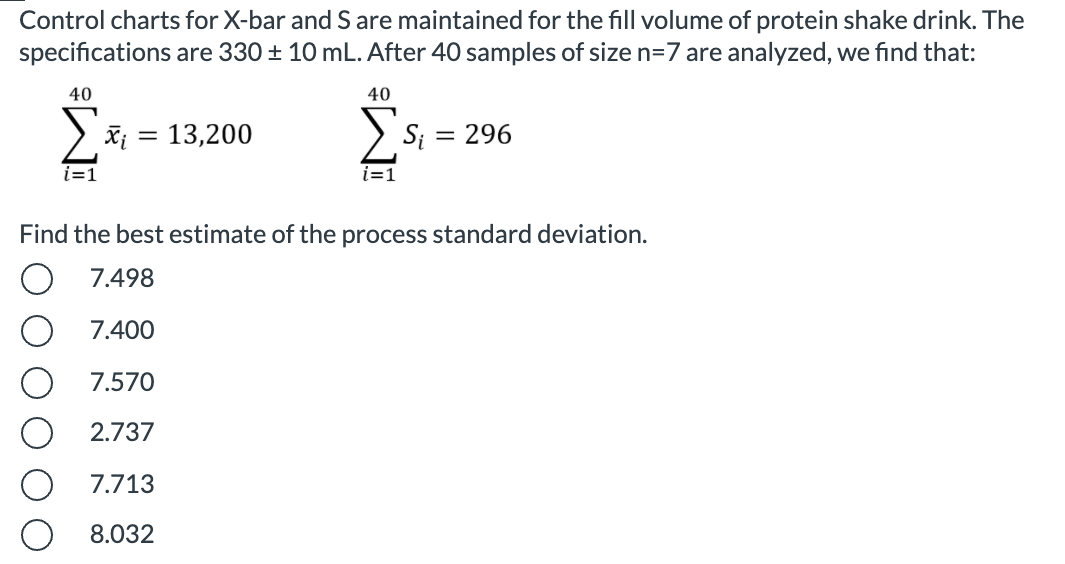
Question: Control charts for X-bar and S are maintained for the fill volume of protein shake drink. The specifications are 330 = 10 mL. After 40

Control charts for X-bar and S are maintained for

Control charts for X-bar and S are maintained for the fill volume of protein shake drink. The specifications are 330 = 10 mL. After 40 samples of size n=7 are analyzed, we find that: 40 40 i = 13,200 Si = 296 i=1 i=1 Find the best estimate of the process standard deviation. 7.498 7.400 7.570 2.737 7.713 8.032

Step by Step Solution

There are 3 Steps involved in it

1 Expert Approved Answer
Step: 1 Unlock blur-text-image
Question Has Been Solved by an Expert!

Get step-by-step solutions from verified subject matter experts

Step: 2 Unlock
Step: 3 Unlock

Students Have Also Explored These Related General Management Questions!