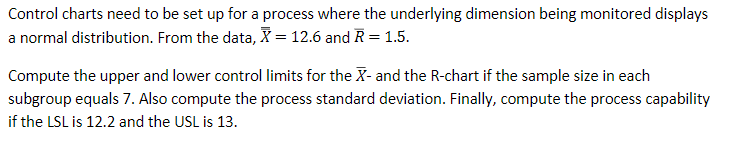
Question: Control charts need to be set up for a process where the underlying dimension being monitored displays a normal distribution. From the data, X =

Control charts need to be set up for a process

Control charts need to be set up for a process where the underlying dimension being monitored displays a normal distribution. From the data, X = 12.6 and R= 1.5. Compute the upper and lower control limits for the X- and the R-chart if the sample size in each subgroup equals 7. Also compute the process standard deviation. Finally, compute the process capability if the LSL is 12.2 and the USL is 13

Step by Step Solution

There are 3 Steps involved in it

1 Expert Approved Answer
Step: 1 Unlock blur-text-image
Question Has Been Solved by an Expert!

Get step-by-step solutions from verified subject matter experts

Step: 2 Unlock
Step: 3 Unlock

Students Have Also Explored These Related General Management Questions!